Results
Overview
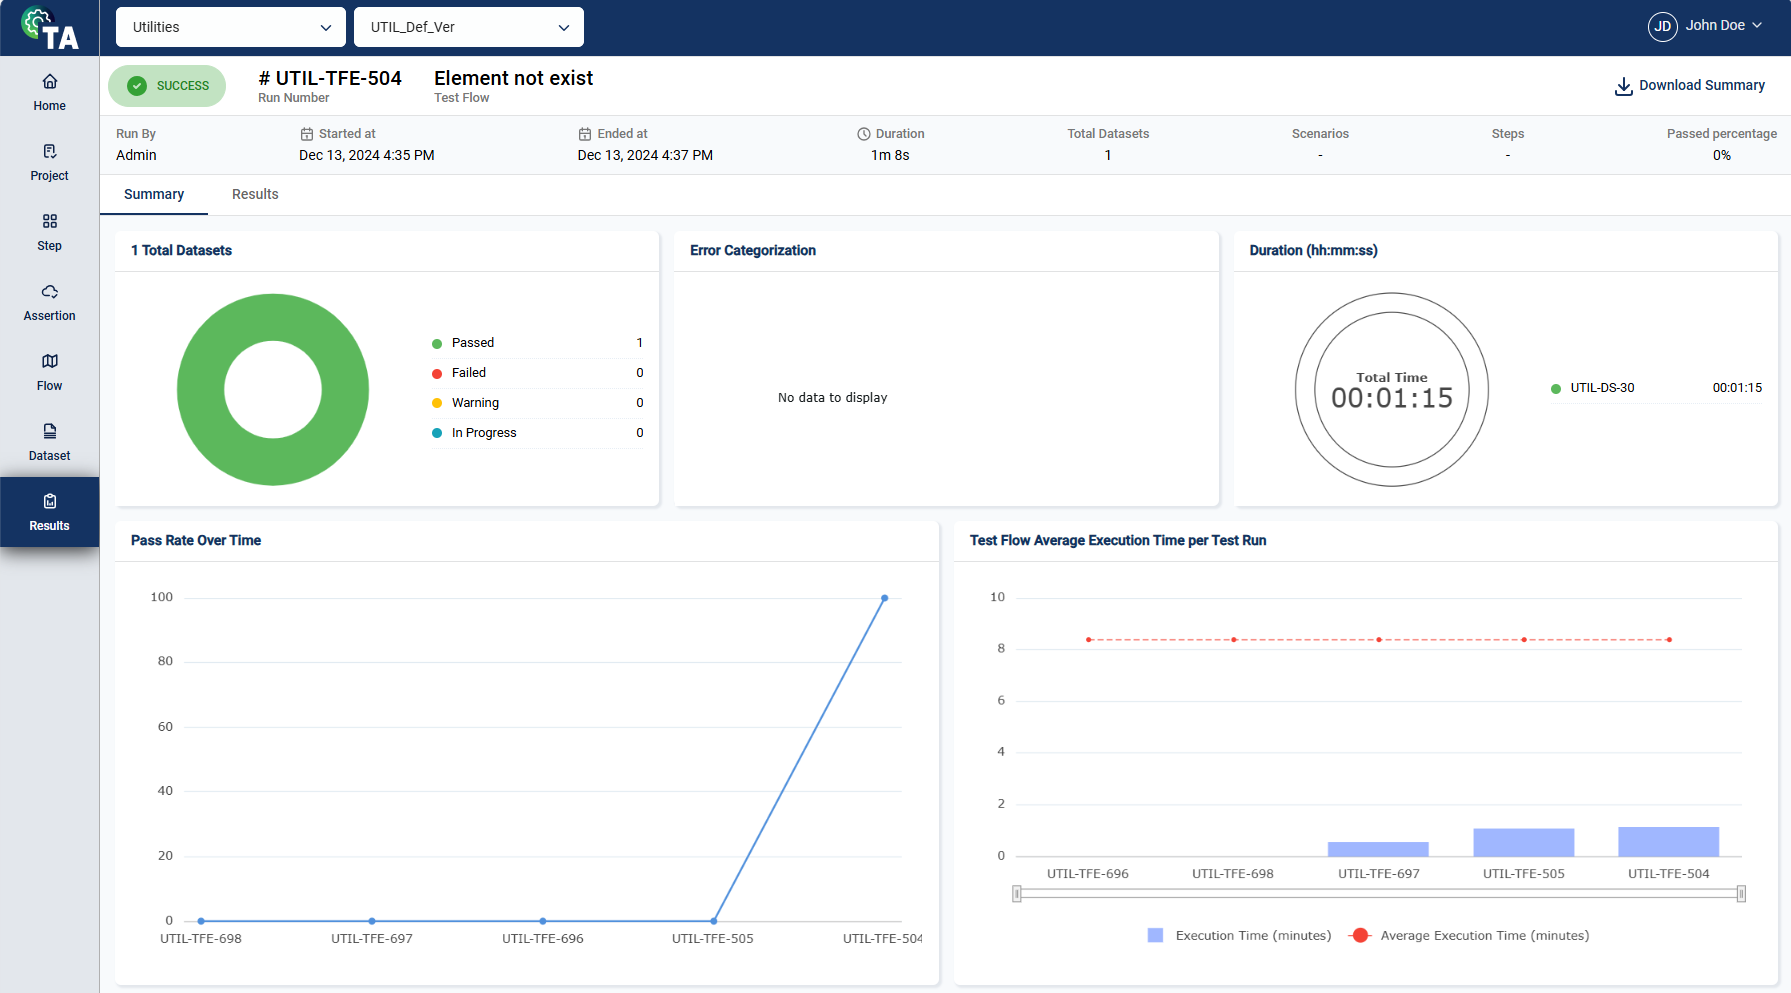
The Results module provides a centralized view of test execution results, allowing you to track real-time progress or review metrics for completed tests. It displays detailed information about the executed scenarios and steps, along with visual summaries like pie charts. There are two tabs in the Results module: Summary and Results.
Header
The header section provides a quick and high-level overview of the test execution with the following details:

| Field | Description |
|---|---|
| Execution status | Indicates the current state of the execution. The possible values are Completed, In Progress, Warning, and Failed. |
| Run Number | Unique identifier of the test execution run. |
| Test Flow | Name of the test flow being executed. |
| Run By | User who initiated the test execution. |
| Started At | Date and time when the test flow execution began. |
| Ended At | Date and time when the test flow execution was completed. |
| Duration | Total time elapsed during the test flow execution. |
| Test Datasets | Number of datasets used during the test execution. |
| Scenarios | Total number of scenarios executed within the test flow. |
| Steps | Total number of steps executed within the test flow. |
| Passed Percentage | Percentage of scenarios that successfully passed. |
| Download Summary | Downloads the Results summary in pdf format. |
Summary
The summary tab displays the Total Datasets, Error Categorization, Duration, Pass Rate Over Time, and Test Flow Average Execution per Test Run.
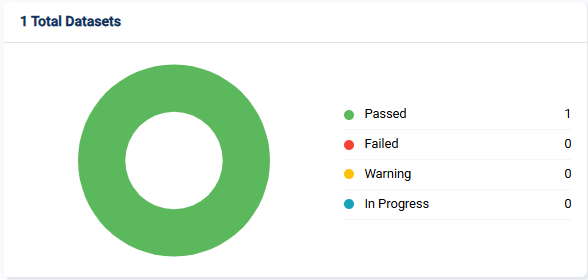
Total Datasets
The Total Datasets pie chart provides a quick visual representation of how many datasets passed, failed, are in warning status, or are still running.
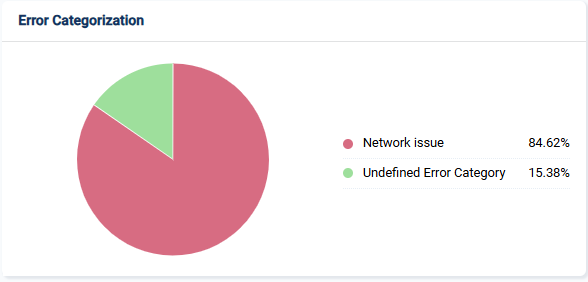
Error Categorization
The Error Categorization pie chart provides a quick visual representation of how the errors are categorized.
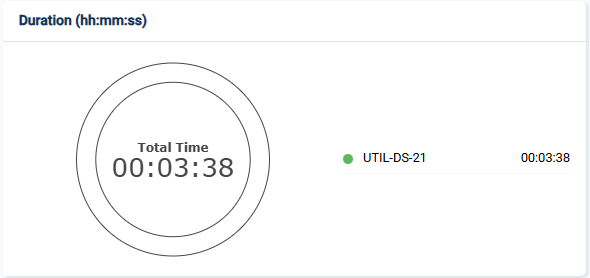
Duration
The Duration chart provides a quick visual representation of how long the test was executed.
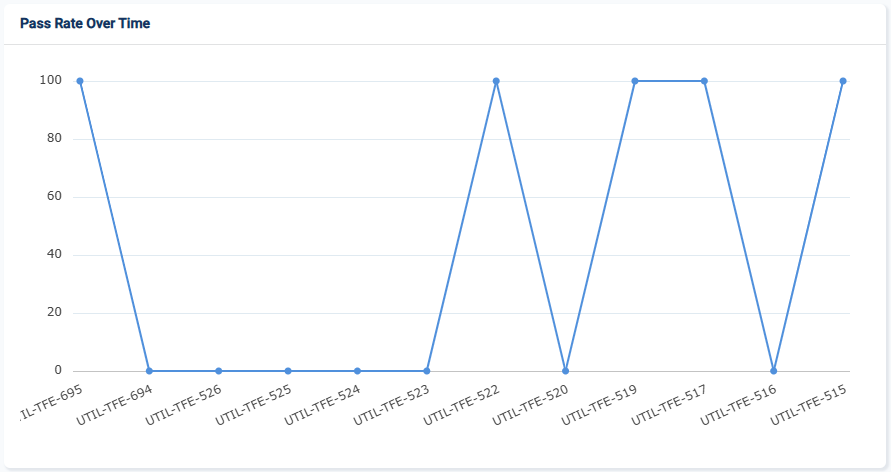
Pass Rate Over Time
The Pass Rate Over Time chart provides a quick visual representation of how the success rate of tests changes throughout the test runs.
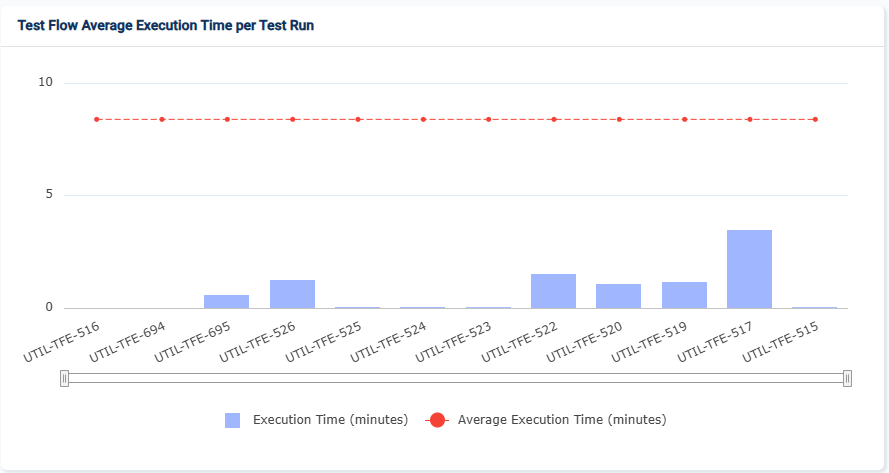
Test Flow Average Execution Time per Test Run
The Test Flow Average Execution Time per Test Run chart provides a quick visual representation of how long the test runs and the average each test run takes to complete.
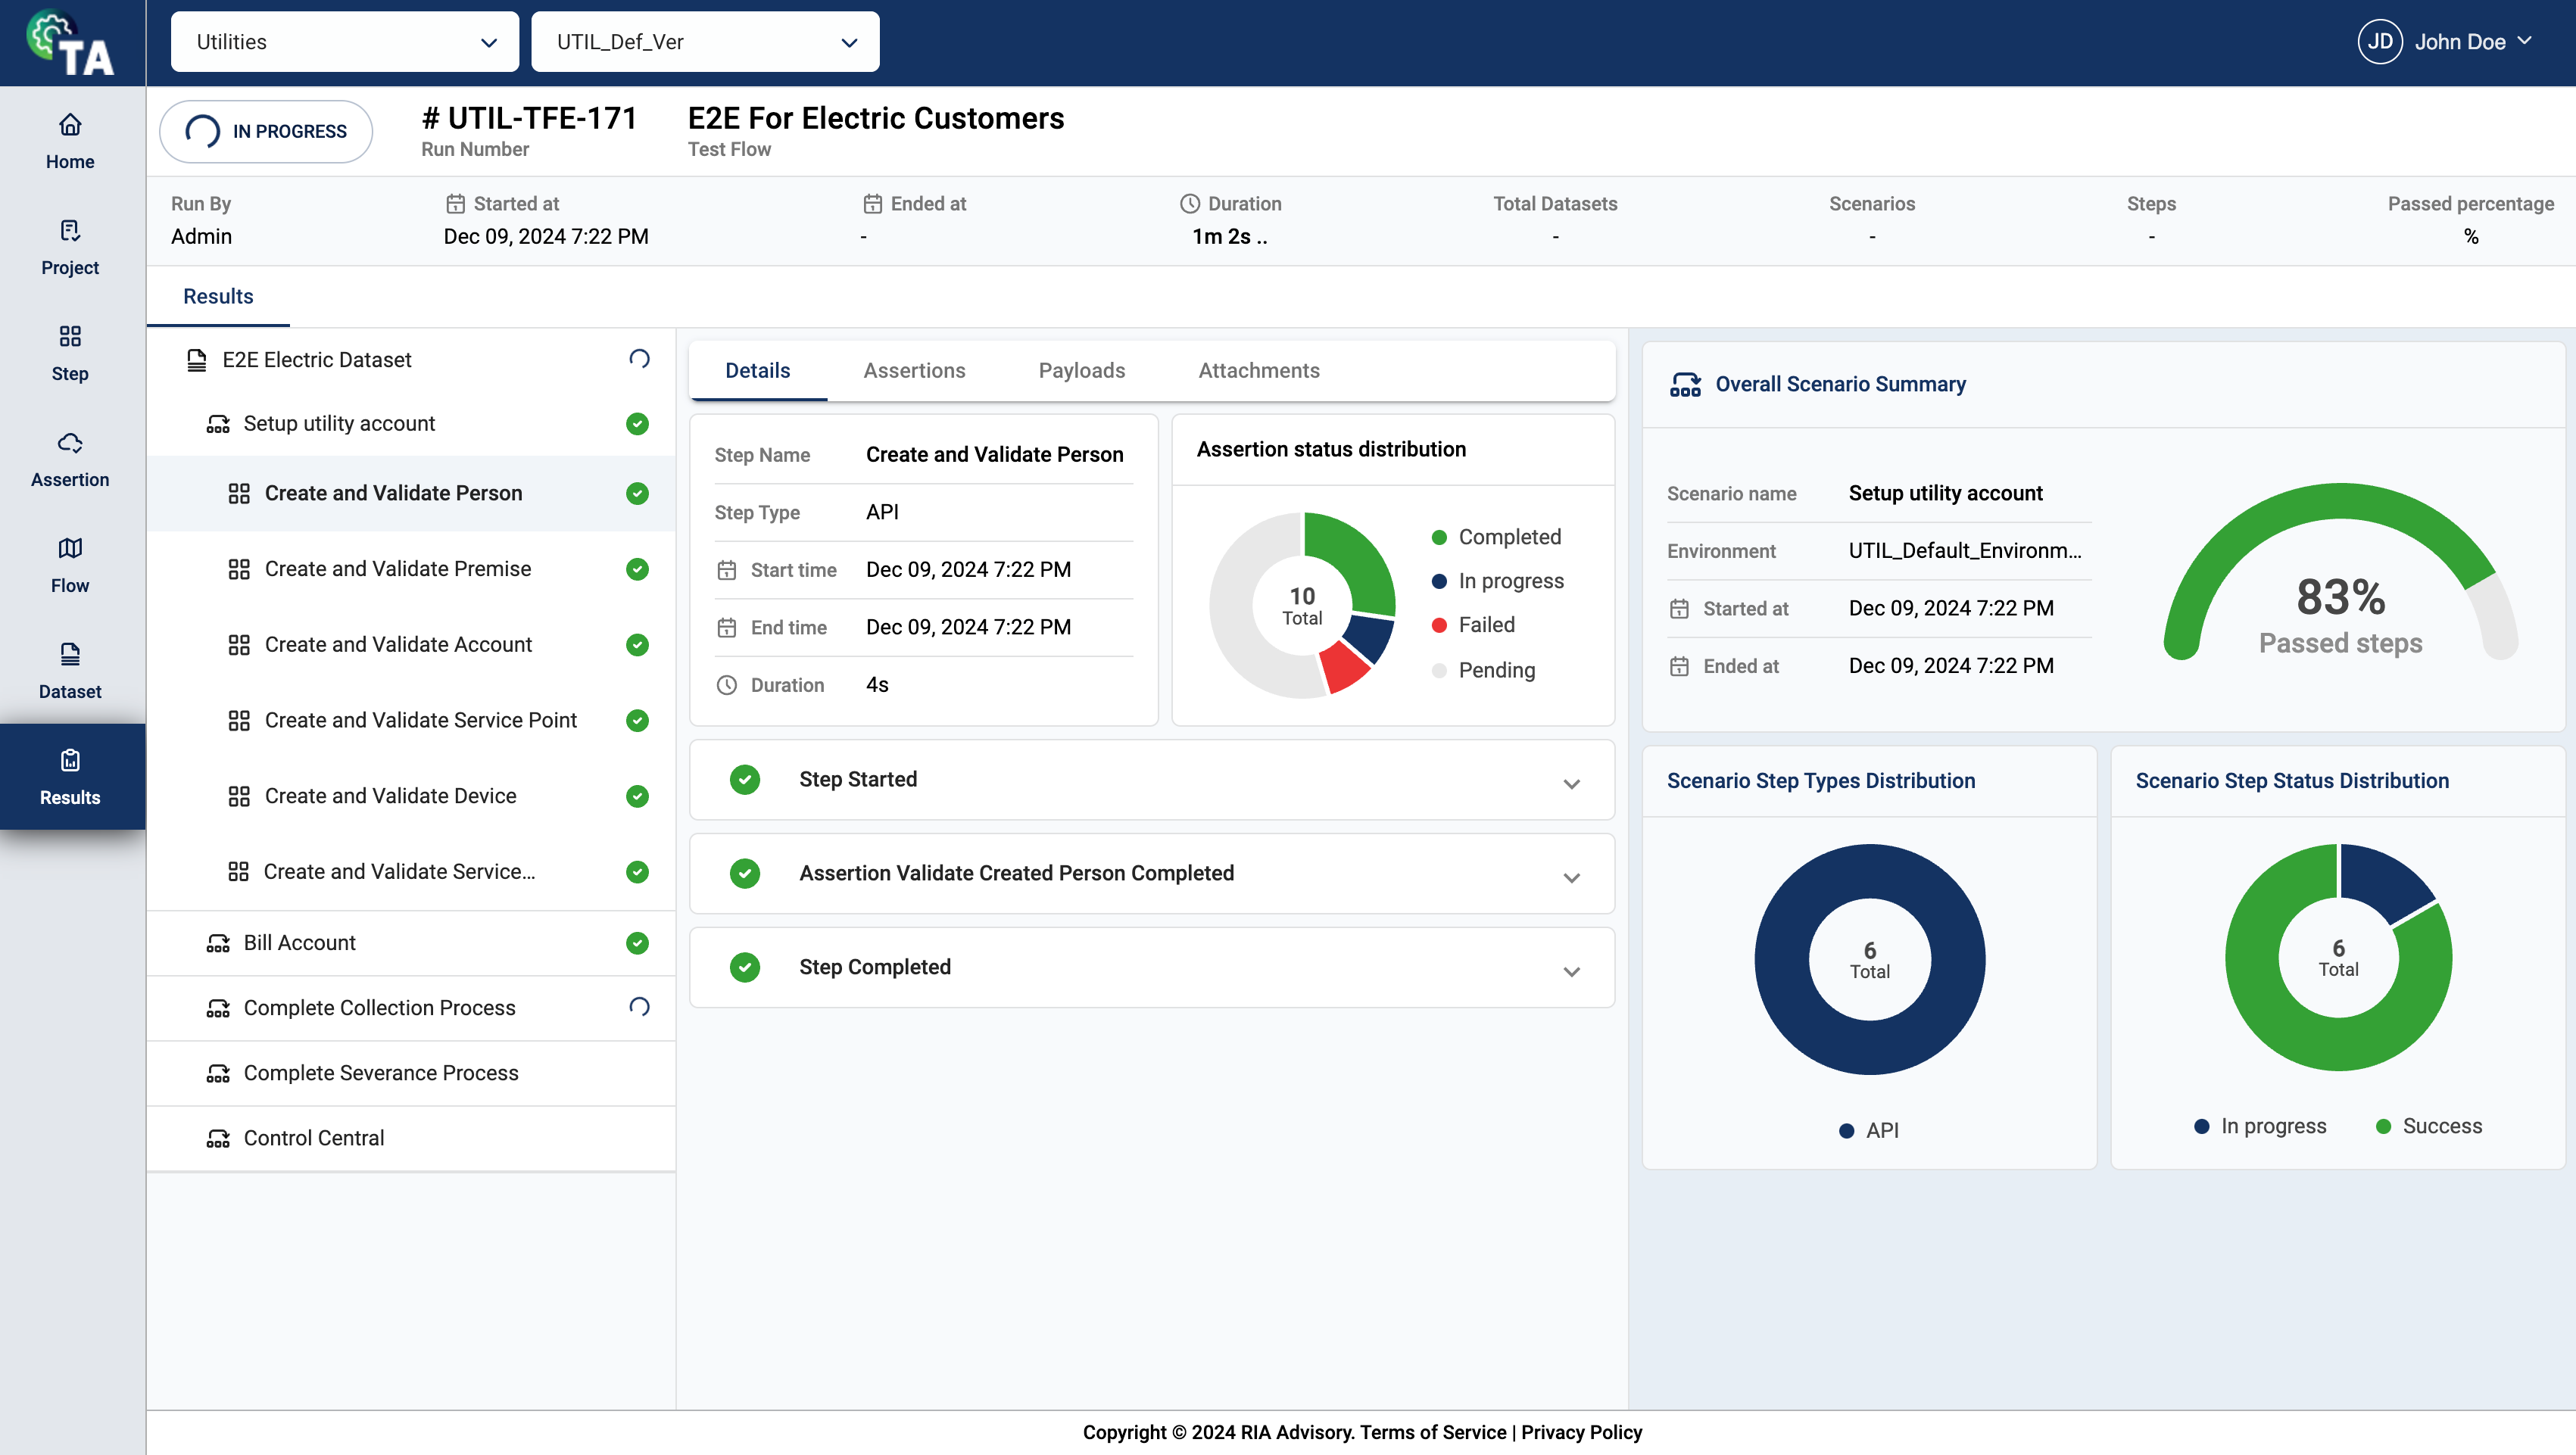
Results
The results tab displays information about the scenarios and steps. Its details, assertions, payloads, and attachments. It also highlights the Overall Scenario Summary, Scenario Step Types Distribution, and Scenario Step Status Distribution.
Scenarios and steps
The dashboard highlights the details of the executed test scenarios and their individual steps. The left pane provides a hierarchical view of the test flow, broken down into its constituent scenarios. Each scenario is further expanded to display the steps within it, allowing users to examine the execution status, duration, and other relevant metrics for each step.
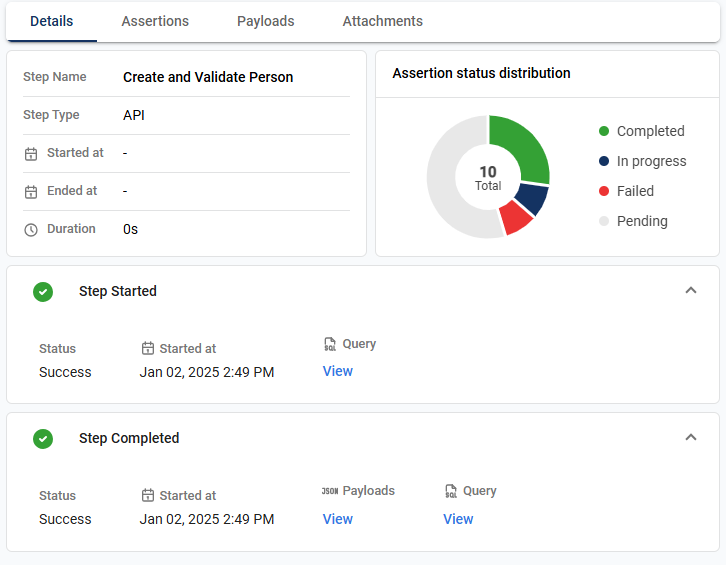
Details
The Details tab displays the following information:
| Field | Description |
|---|---|
| Step Name | Name of the selected step. |
| Step Type | Type of the selected step. |
| Start time | Date and time when the test step execution began. |
| End time | Date and time when the test step execution was completed. |
| Duration | Total time elapsed during the test step execution. |
| Assertion status distribution | Pie chart that provides the status distribution of the assertions. |
| Step Started | Displays the step status, date and time the step execution began, and the query if available. |
| Step Failed | Displays the step status, date and time the step execution began, payloads, and the query if available. |
| Step Completed | Displays the step status, date and time the step execution began, and the payloads. |
Assertions
The Assertions tab displays a detailed list of all the field names specified for validation within the selected test step. For each field, the expected value, the actual value, and the operator are displayed in a tabular form.
When the expected and actual values are the same, meaning the validation passed, the row is highlighted in green. Otherwise, the row will be red.
.png)
Payloads
If the step type is API, the Payloads tab provides access to the request and response payloads associated with the selected step. This tab allows you to review the details of the data exchanged during the execution. Additionally, you can search for specific nodes by entering a keyword or the full parameter in the search text box.
.png)
Attachments
The Attachments tab displays all files utilized during the test step execution. This includes any relevant documents, logs, or additional files uploaded for reference during the test.
Overall Scenario Summary
The Overall Scenario Summary offers a high-level overview of the scenario to which the selected step belongs.
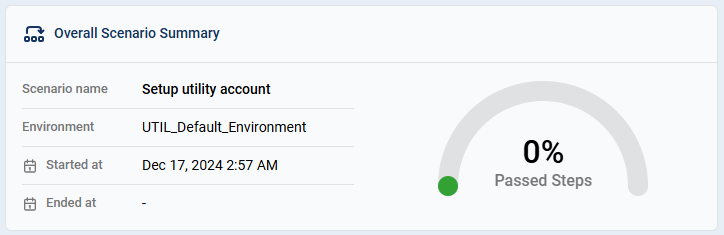
| Field | Description |
|---|---|
| Scenario name | Name of the scenario to which the selected step belongs. |
| Environment | Environment where the test scenario was executed. |
| Started at | Date and time when the test scenario execution began. |
| Ended at | Date and time when the test scenario execution was completed. |
| Passed steps | Percentage of the passed steps within the scenario. |
Scenario Step Types Distribution
The Scenario Step Types Distribution pie chart shows the proportion of different step types within the selected scenario, such as API, UI, or database steps.
Scenario Step Status Distribution
The Scenario Step Status Distribution pie chart provides a quick visual representation of how many steps passed, failed, or are still running.