Run Results
Run Results
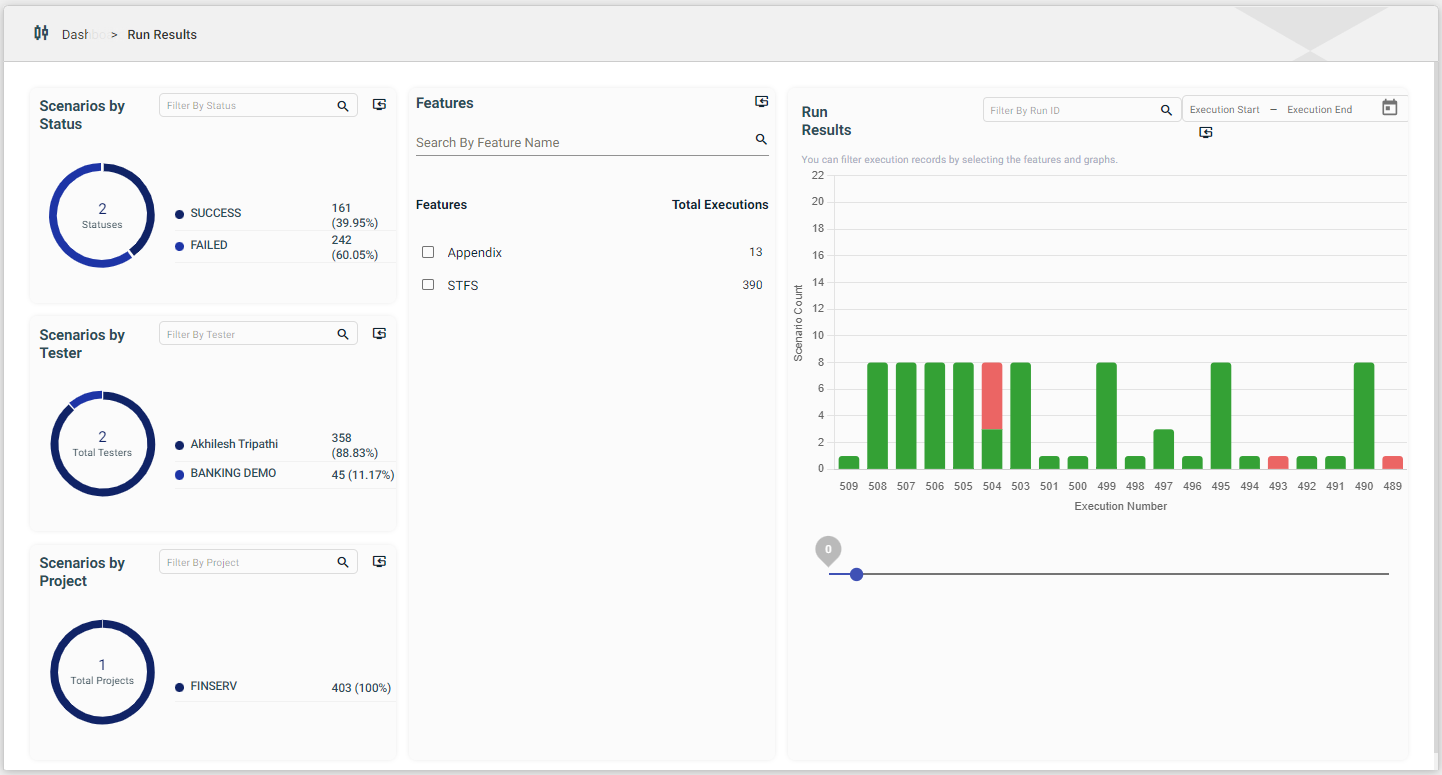
The Run Results module allows you to view the results of executed scenarios and offers customizable filters to generate a personalized view.
To access the Environment module, navigate to Test Run & Results > Run Results.
Scenarios by Status
The Scenarios by Status section shows a donut graph with all the available execution statuses and the total number of project executions that have resulted in each status. You can click on any part of the graph to view the Run Results graph with only the project executions that have the same status as the selected part. You can also filter the list by typing a keyword or the full name of the status. To reset the Scenarios by Status, click ![]() .
.
Scenarios by Tester
The Scenarios by Tester section shows a donut graph with all the testers and the total number of project executions performed by each tester. You can click one or more parts of the graph to view the Run Results graph with only the project executions of the selected testers. You can also filter the list by typing a keyword or the full name of the tester. To reset the Scenarios by Tester, click ![]() .
.
Scenarios by Project
The Scenarios by Tester section shows a donut graph with all the testers and the total number of project executions performed by each tester. You can click one or more parts of the graph to view the Run Results graph with only the project executions of the selected testers. You can also filter the list by typing a keyword or the full name of the tester. To reset the Scenarios by Tester, click ![]() .
.
Features
The Features section shows a list of all the features and the total number of executions of the projects associated with each feature. You can tick the checkbox of a feature to view the Run Results graph with only the project executions of the selected feature. You can also filter the list by typing a keyword or the full name of the tester. To reset the Features, click ![]() .
.
Run Results
The Run Results section displays a graph with the execution number and the number of scenarios tested in each execution number. Each bar of the graph is color-coded, which when hovered on, will display the status and the number of scenarios for each status.
You can search for a specific execution by typing the execution number in the Filter by Run ID text field. You can also display the executions for a timeline by providing the dates for the Execution Start and Execution End text fields, or by selecting a date using the calendar icon.
You can also specify the number of bars to be displayed on the graph by moving the blue marker on the line below the graph.