Home
Overview
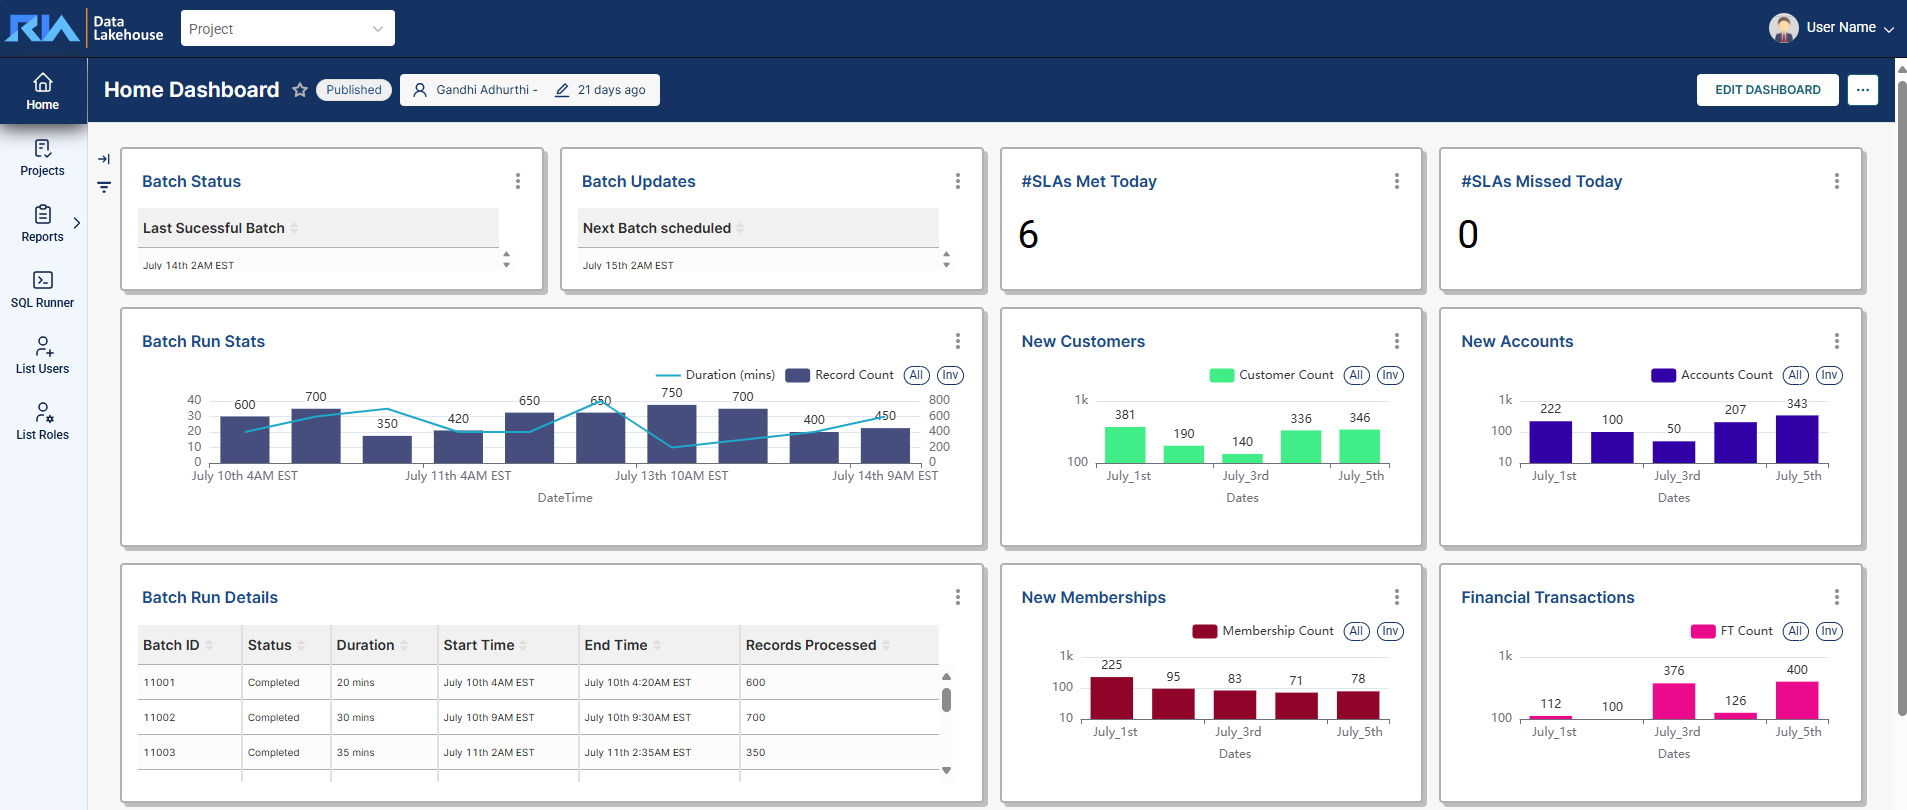
The Homepage is a customizable dashboard that presents reports, charts, and performance indicators relevant to the user’s role or activities. It provides a centralized view of reports helping you to monitor metrics for your operational or data analytical needs.
You can modify the layout by adding, removing, or rearranging widgets and visual elements such as rows and columns. Each component can be configured to display selected data sources, allowing you to design a dashboard that aligns with your business needs.
Edit a dashboard
To edit a dashboard, click the EDIT DASHBOARD button. When modifying a dashboard, you can move, delete, or change the background color of the existing tiles. After making any change, click the SAVE button.
Add a Chart
The Charts tab displays all charts accessible to your account. You can filter or sort the list to make searching easier.
To create a new chart, click the + CREATE A NEW CHART link. This will take you to the Report - Charts module.
To add a chart to your dashboard, drag it to the dashboard.
Add a layout element
You can also add the following elements to your dashboard:
- Tabs
- Row
- Column
- Header
- Text/Markdown
- Divider
Other options
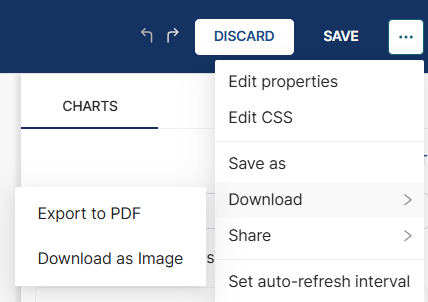
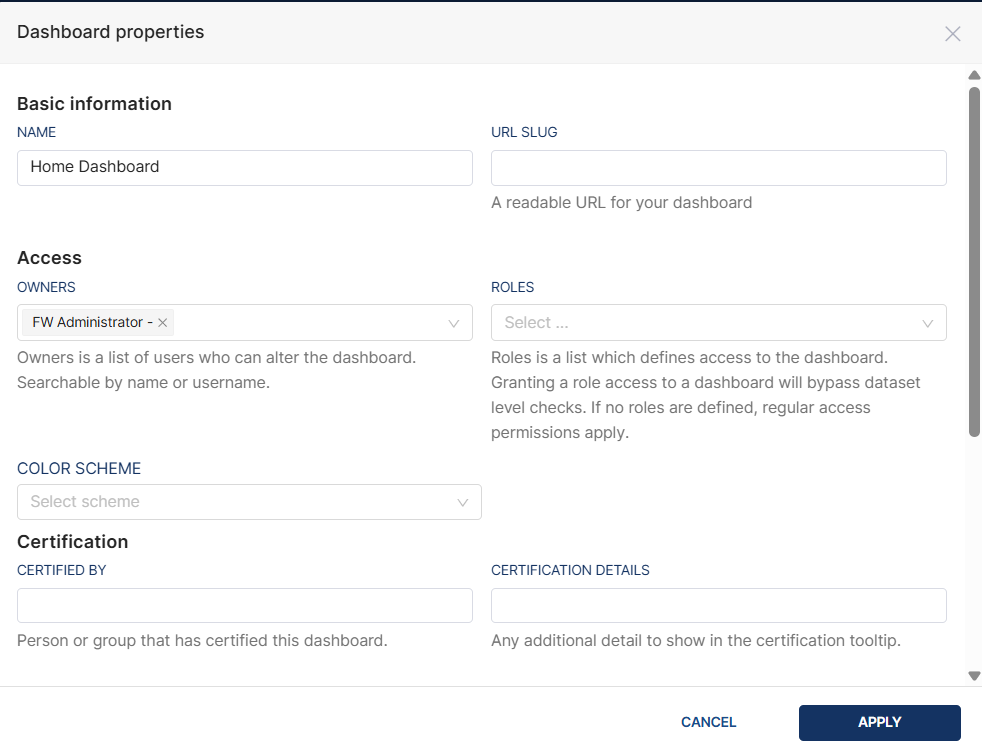
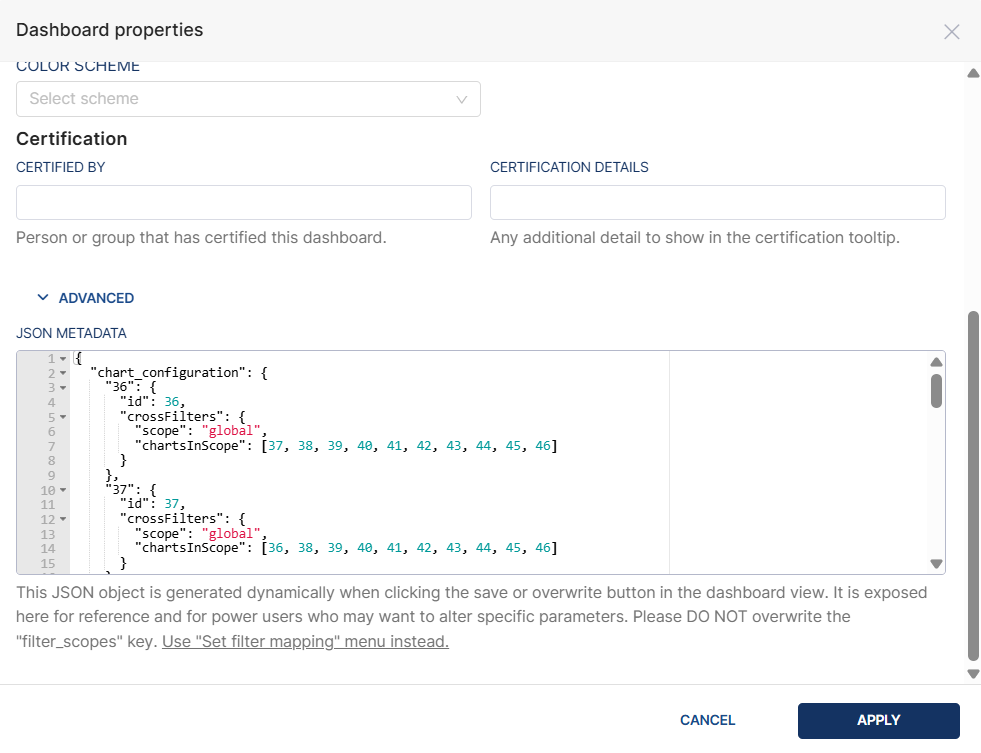
Edit properties
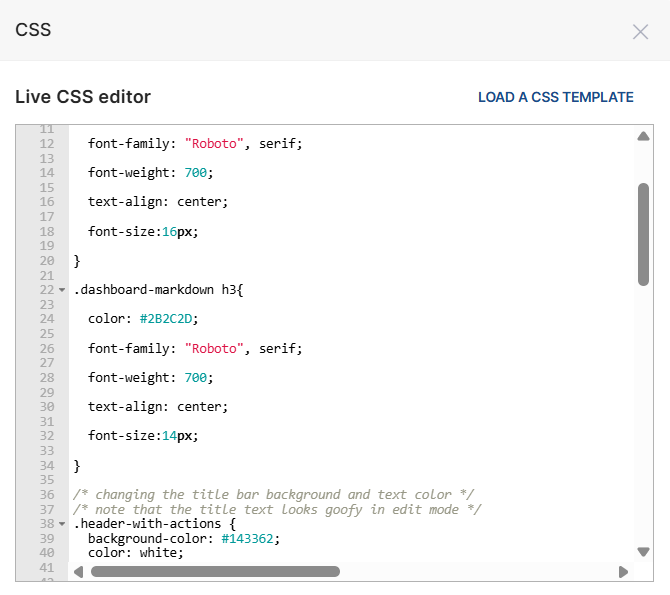
Edit CSS
You can customize the appearance of your dashboard by modifying the CSS properties. The RDA includes a CSS editor that allows you to change various design elements, such as colors and fonts, to create a more personalized dashboard aligned with your business needs.
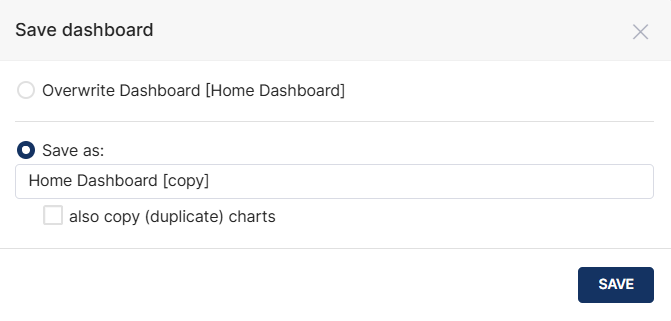
Save as After modifying your dashboard, you can choose to save it as a new dashboard or overwrite the current one.
Download You can download the modified dashboard as either a new image or a PDF file.
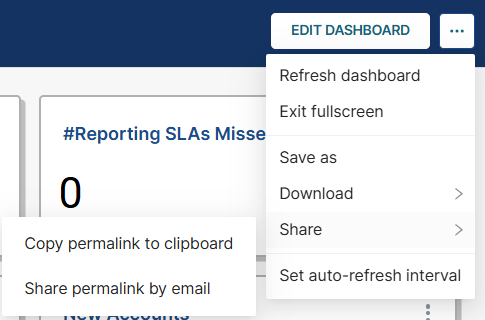
Share The modified dashboard can be shared in two ways:
- by copying the link to the clipboard or
- by sending the link via email.
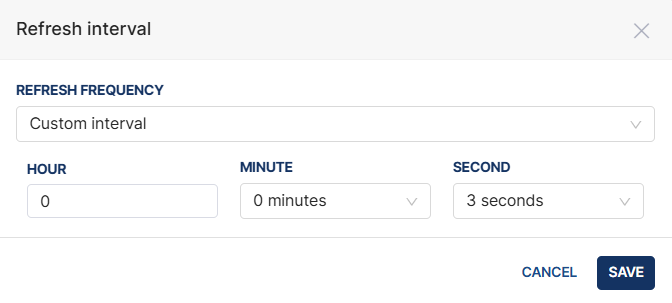
Set auto-refresh interval The set auto-refresh interval feature allows you to define how often data on the dashboard or screen automatically updates without manual refresh. You can choose any time in the dropdown list.
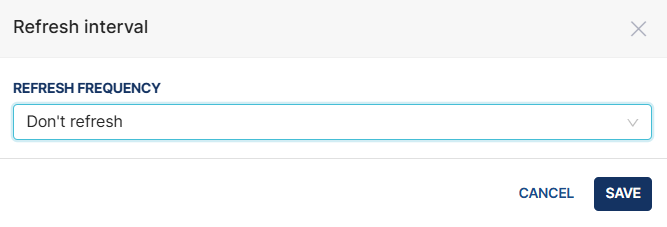
You can also create a customized time frequency by specifying the hour, minute, or second.
Layout element options
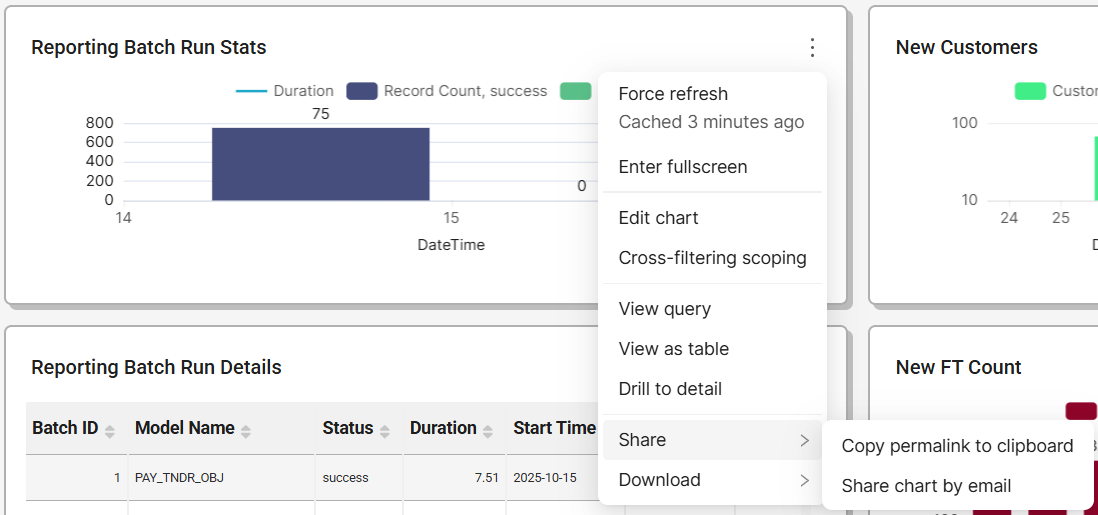
Aside from the whole dashboard options, you can also do the following actions to a specific layout element.
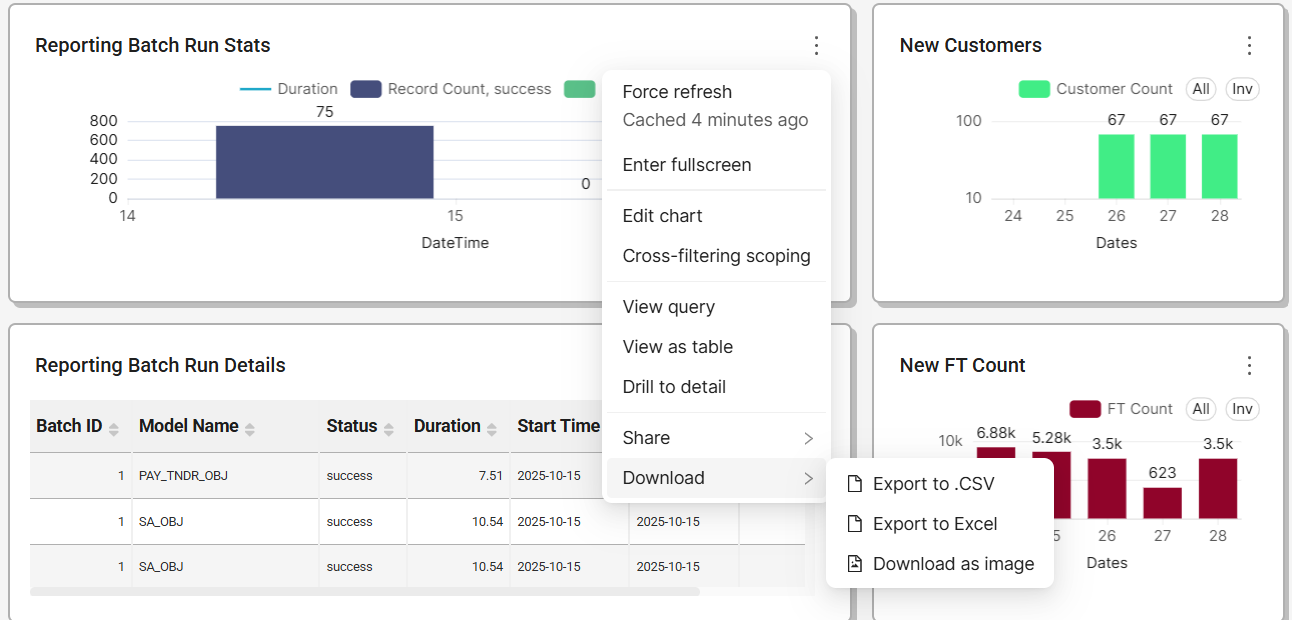
Force refresh
To retrieve the most current version fo the displayed data in the layout element, select Force refresh.
Enter fullscreen
To view the layout element in fullscreen, select Enter fulscreen.
To exit the fullscreen mode, click the shrink icon or select Exit fullscreen in the options.
Edit chart
You can also edit the layout element by selecting Edit chart. Upon clicking, you will directed to the Reports module.
Cross-filtering scoping

View query
If you want to view the query used to display the data, select View query.
View table
You can also view the displayed data in a table by clicking View table.

Drill to detail
RDA also allows you to view the data displayed in the layout element by clicking Drill to detail.
Share
The particular layout element can be shared in two ways:
- by copying the link to the clipboard or
- by sending the link via email.
Download
You can download the details shown in the layout element as a .CSV or Excel file. Additionally, you can download the layout element as an image.