Reports - Charts
Overview
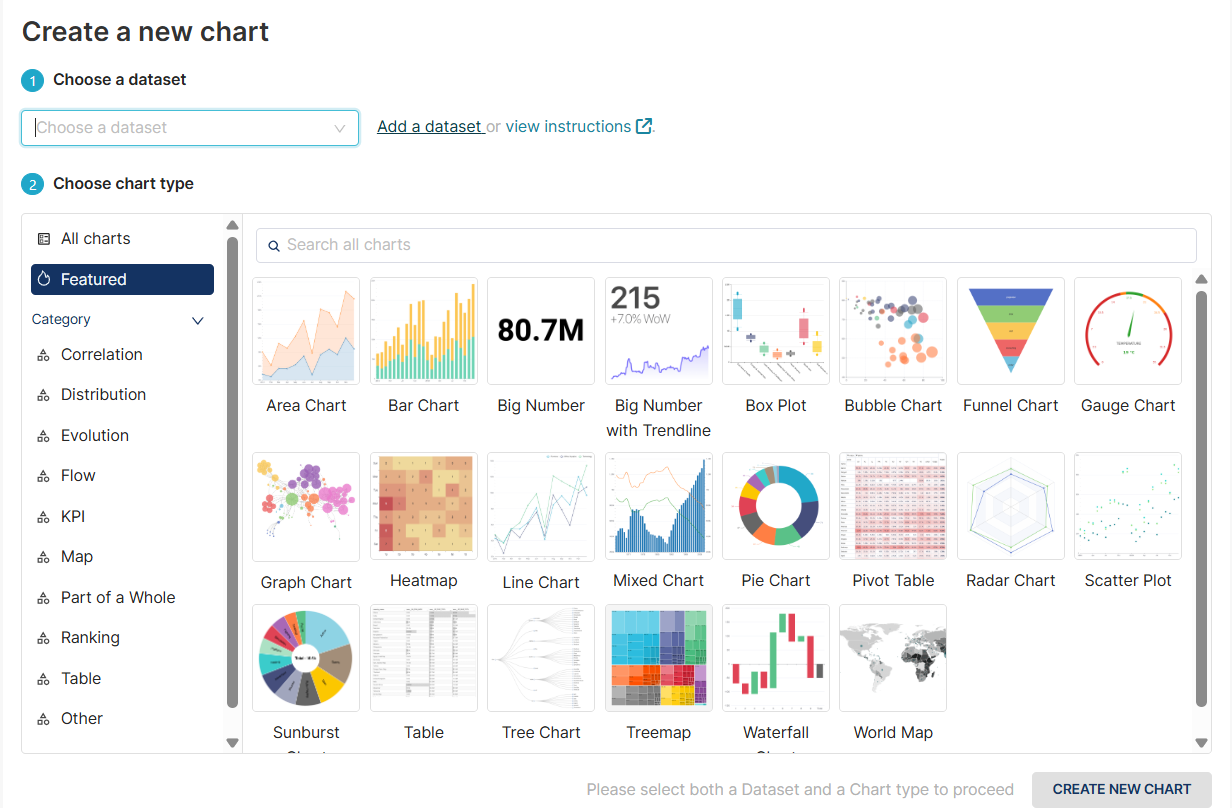
Create a chart with an existing dataset
When creating a chart, using an existing dataset, follow these steps:
-
Click the + CHART on the upper-right corner of the page.
-
Select an existing dataset from the dropdown list.
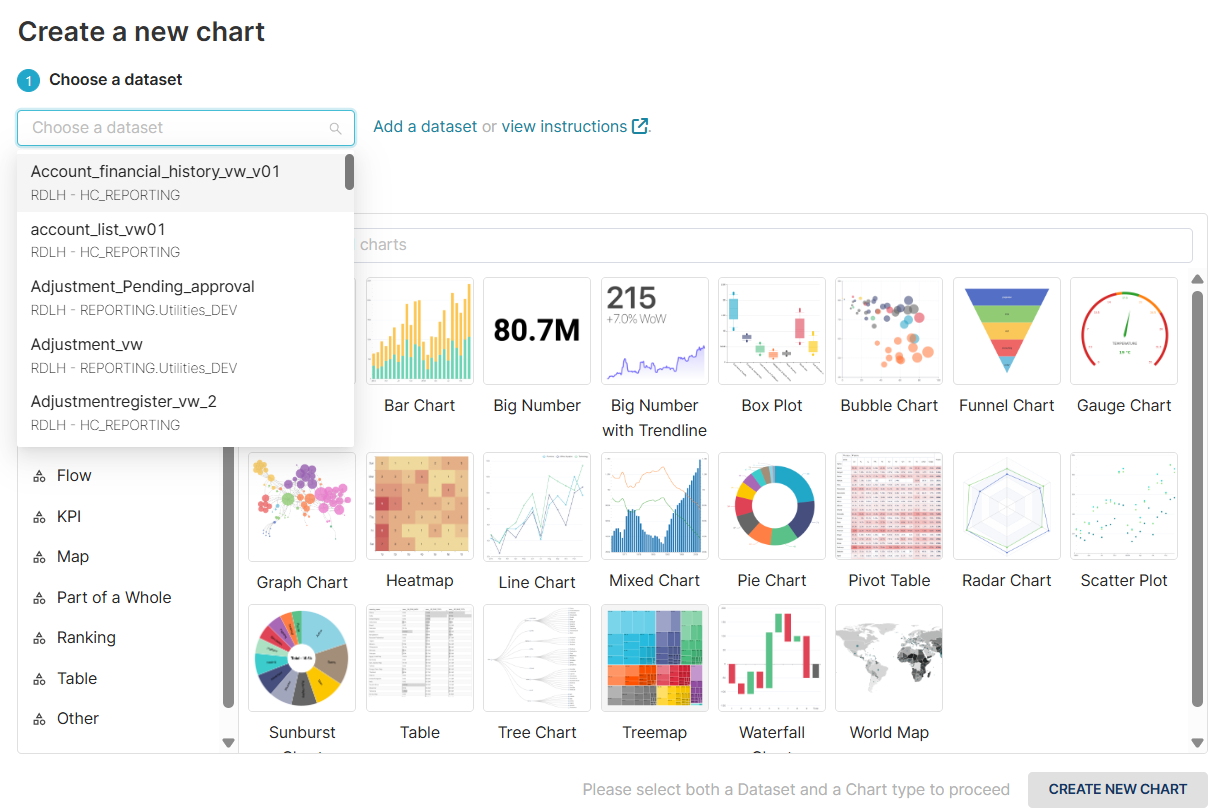
-
Select a chart type.
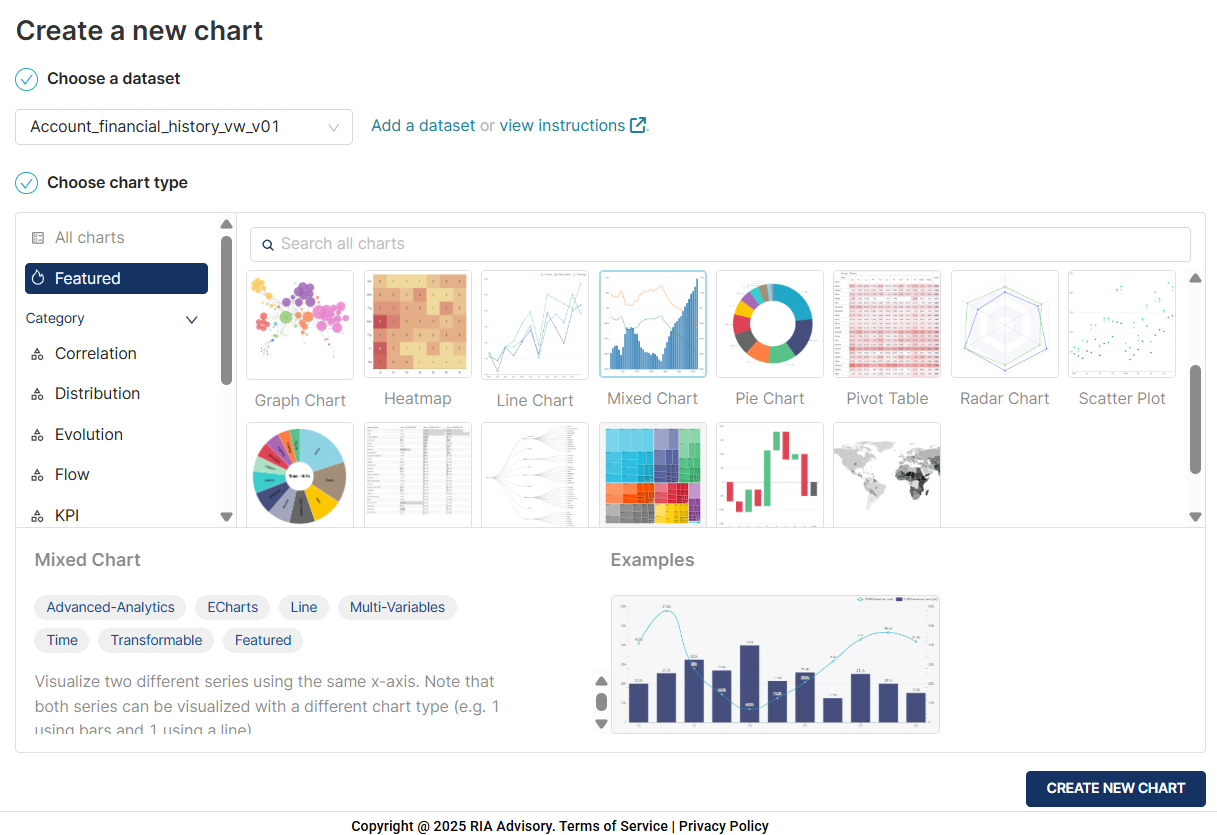
-
Click the CREATE A NEW CHART button.
-
Add a name for the chart.
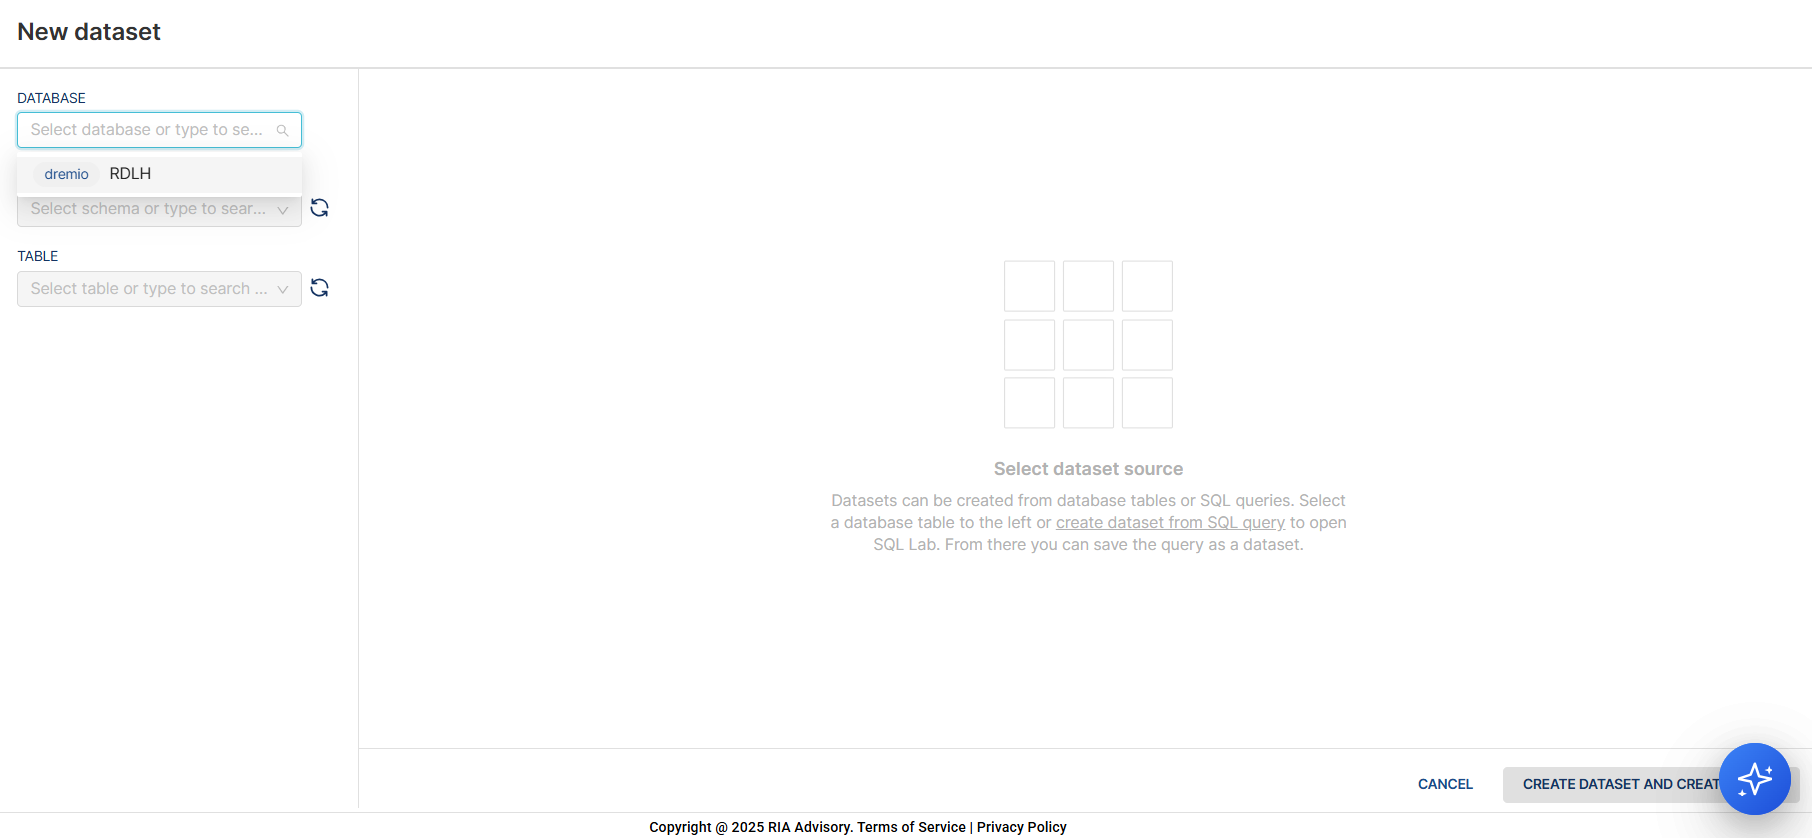
Create a chart with a new dataset
When creating a new dataset and use it to create a new chart, follow these steps:
- Click the + CHART on the upper-right corner of the page.
- Click Add a dataset link in the Choose a dataset step.
- Select a database in the the DATABASE dropdown list.
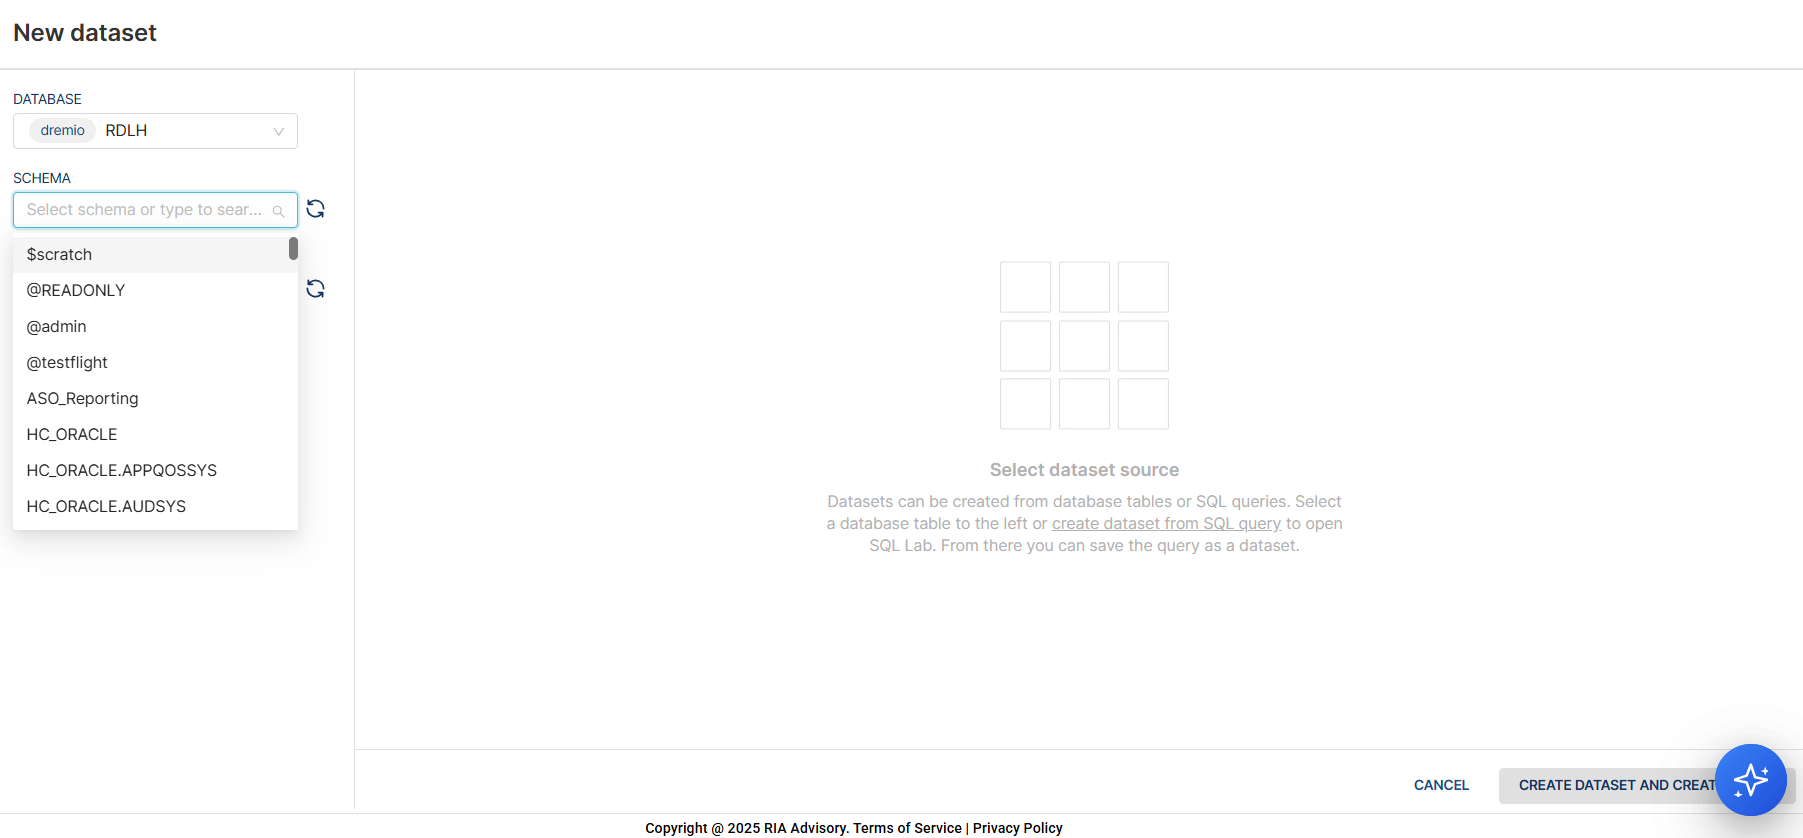
- Select a schema in the the SCHEMA dropdown list.
-
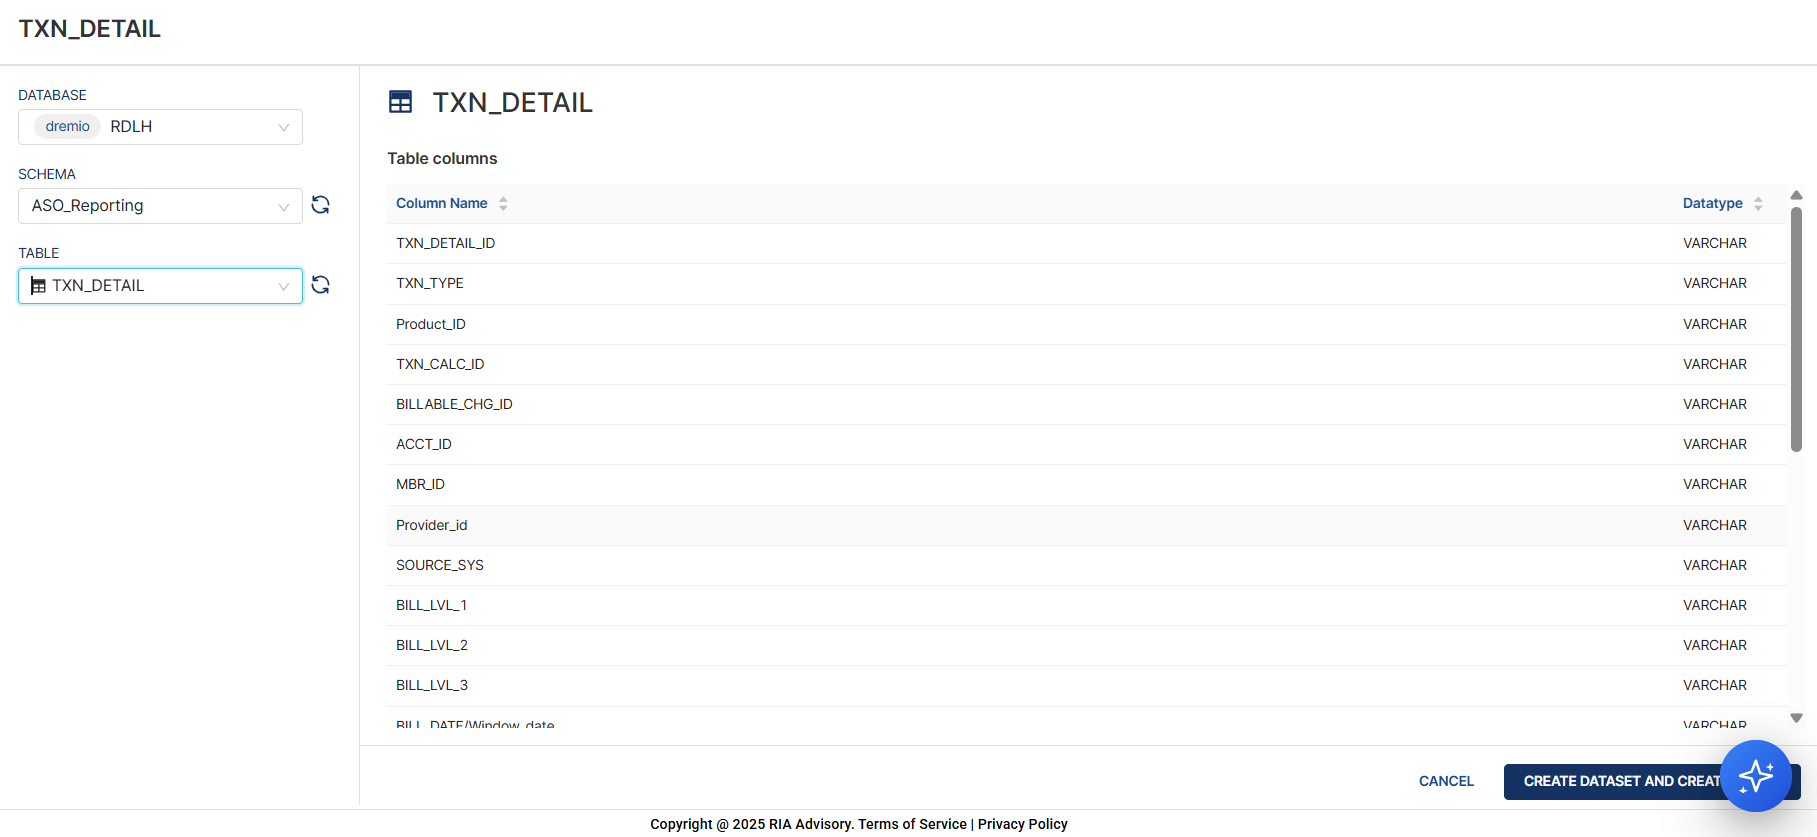
Select a table in the the TABLE dropdown list.
Note that you can only create 1 dataset for a table. All tables that have been used to create a new dataset are marked with a warning sign.
-
Add a name for the chart.
Configure your chart
Chart source
The selected dataset in the previous section will be the chart source. The following are the available actions for you:
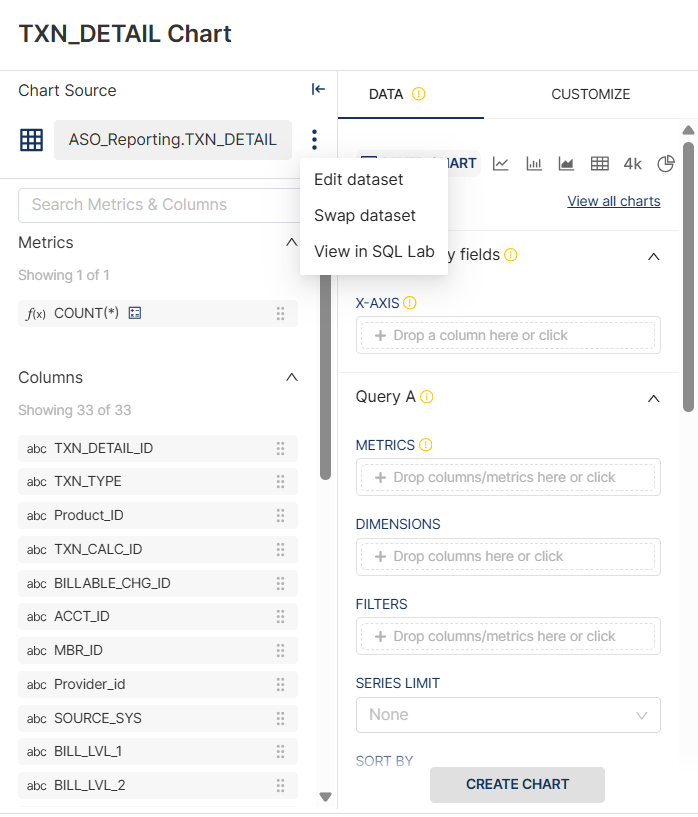
- Edit dataset — You can modify the dataset properties as you will do it in the Superset. To know more details, see Creating Your First Dashboard.
- Swap dataset — You can change the dataset after initiating a creation of a new chart.
- View in SQL Lab
Metrics and Columns
The configured metrics and columns of the table are displayed on the pane. You can also search for a metric or a column by entering a valid keyword or name in the Search Metrics & Columns textbox.
Data
The data is configured in a similar way as you will do it in the Superset. To know more details, see Creating Your First Dashboard.
For example, for a mixed chart, you have to configure two queries.
Customize your chart
A chart can be customize in in a similar way as you will do it in the Superset. To know more details, see Creating Your First Dashboard.
For example, you can add labels to an axis and change the series type of a query.
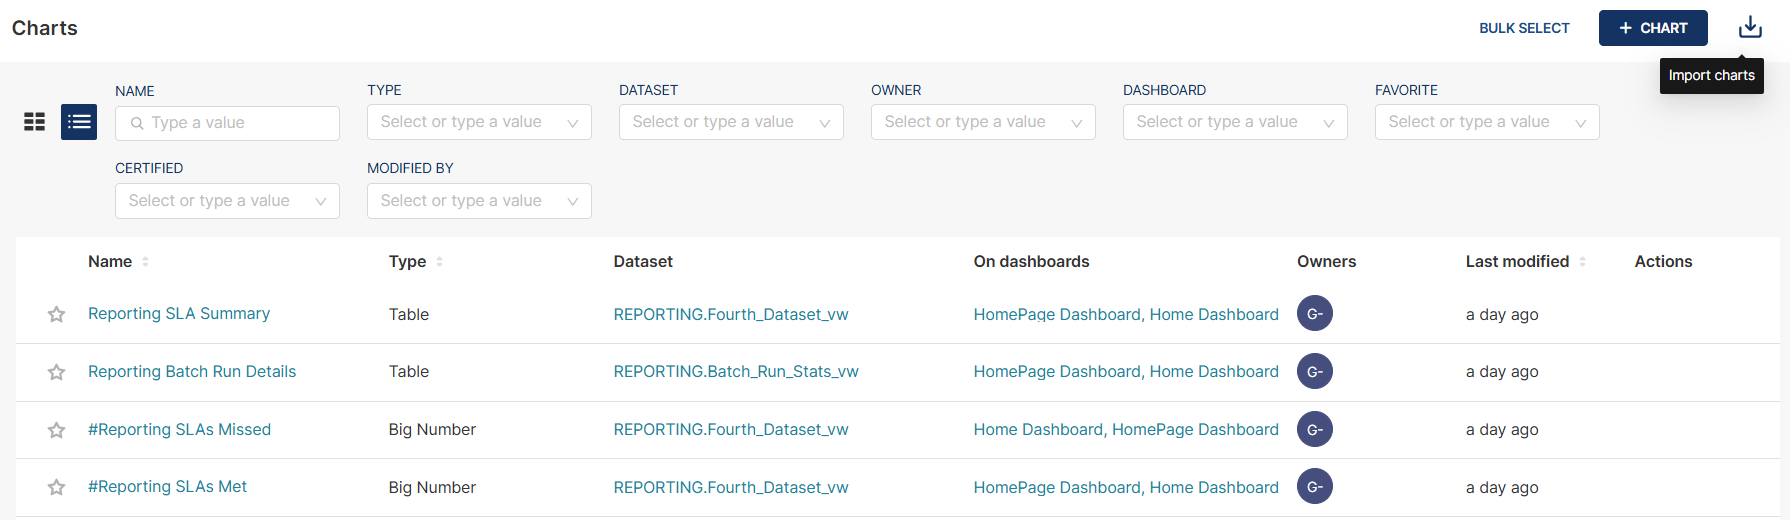
Import a chart
You can also import an existing chart.
To import an existing chart, follow these steps:
- Click the import icon on the upper-right corner of the page.
- Click the SELECT FILE link on the Import chart popup window.
- Select the zip file for import.
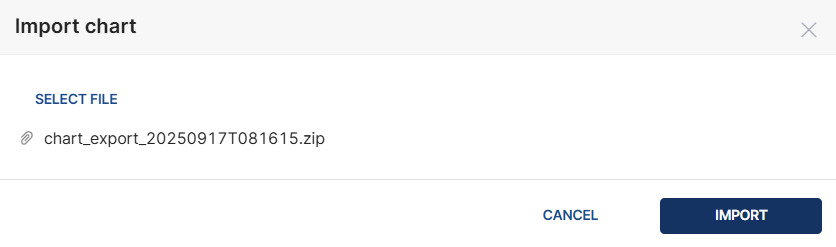
- Click the IMPORT button.
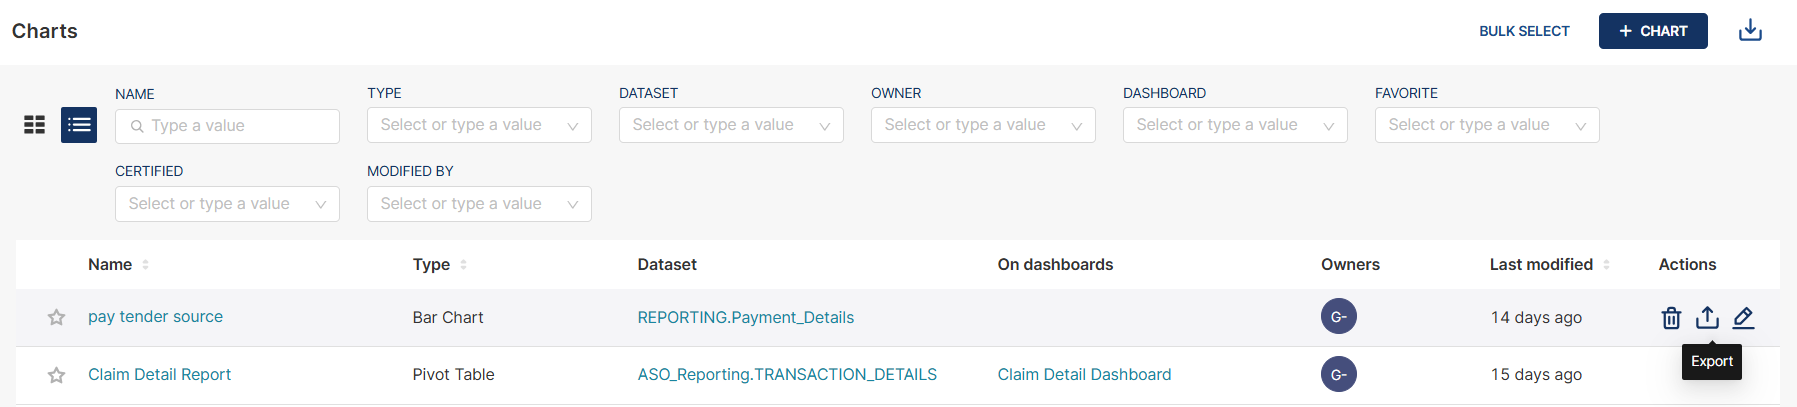
Export a chart
You can also export a chart by clicking the export icon on the row of the report your wish to export. After clicking the icon, a zip file is automatically downloaded.
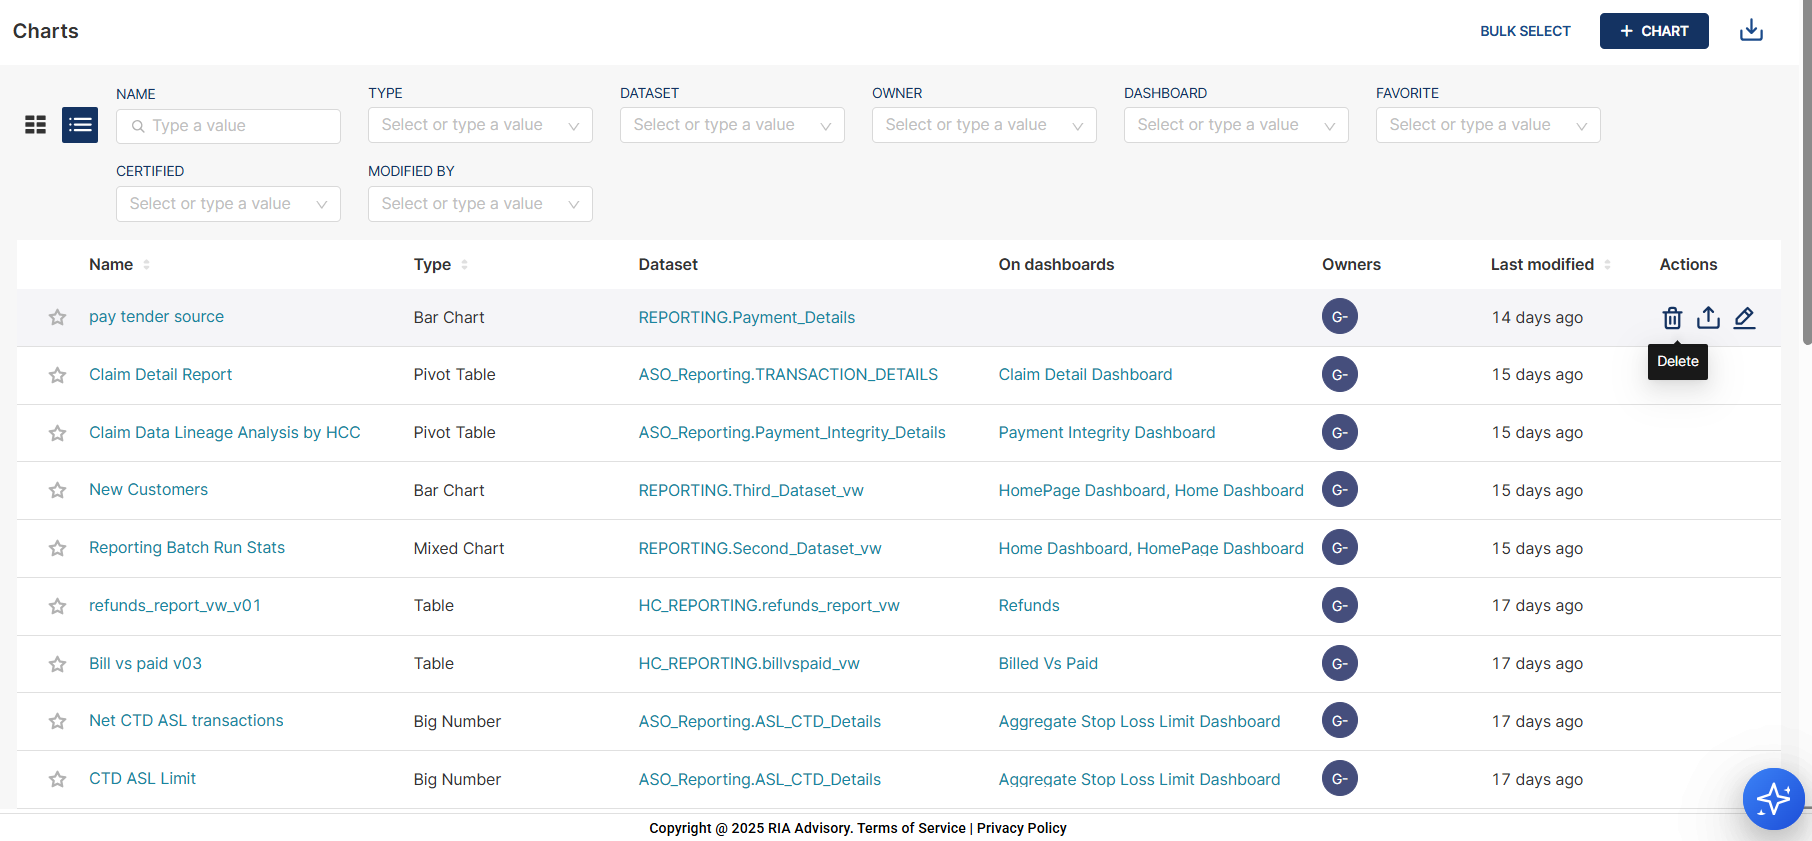
Delete a chart
To delete a chart, follow these steps:
-
Click the delete icon in the Actions column on the row of the report you wish to delete.
-
Enter
DELETEin the textbox for confirmation.
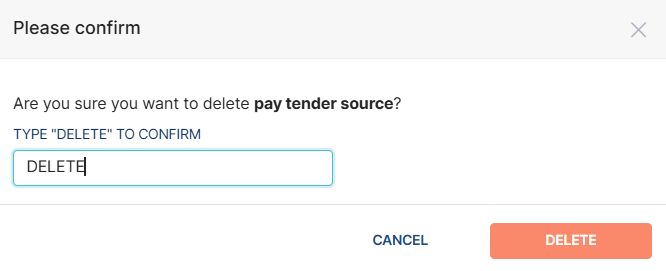
- Click the DELETE button.
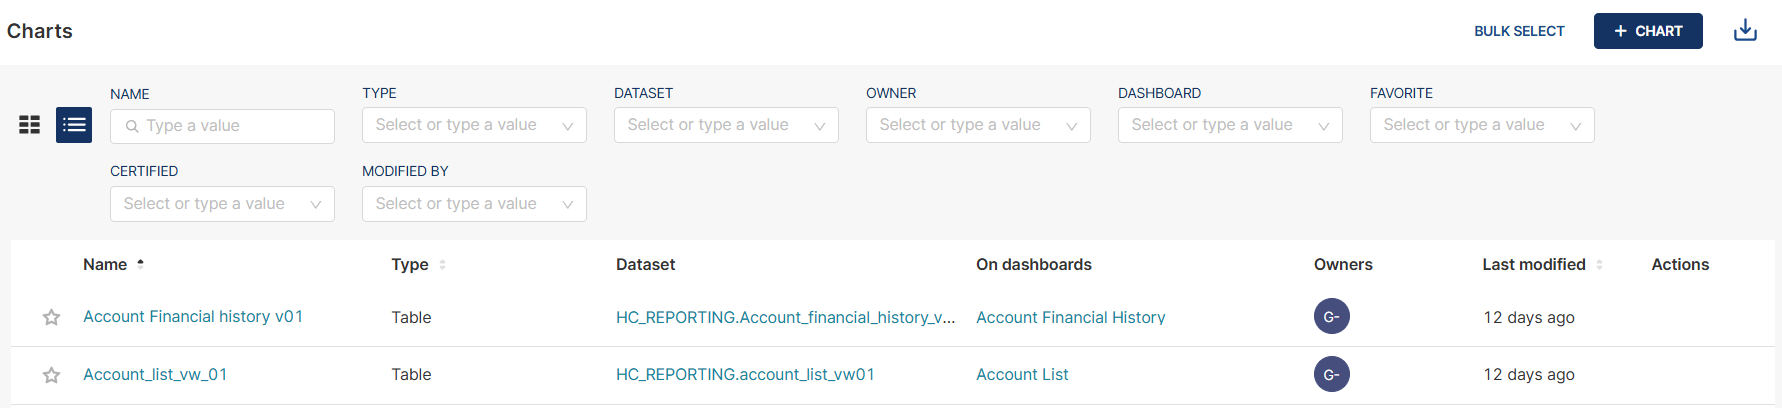
View
List view
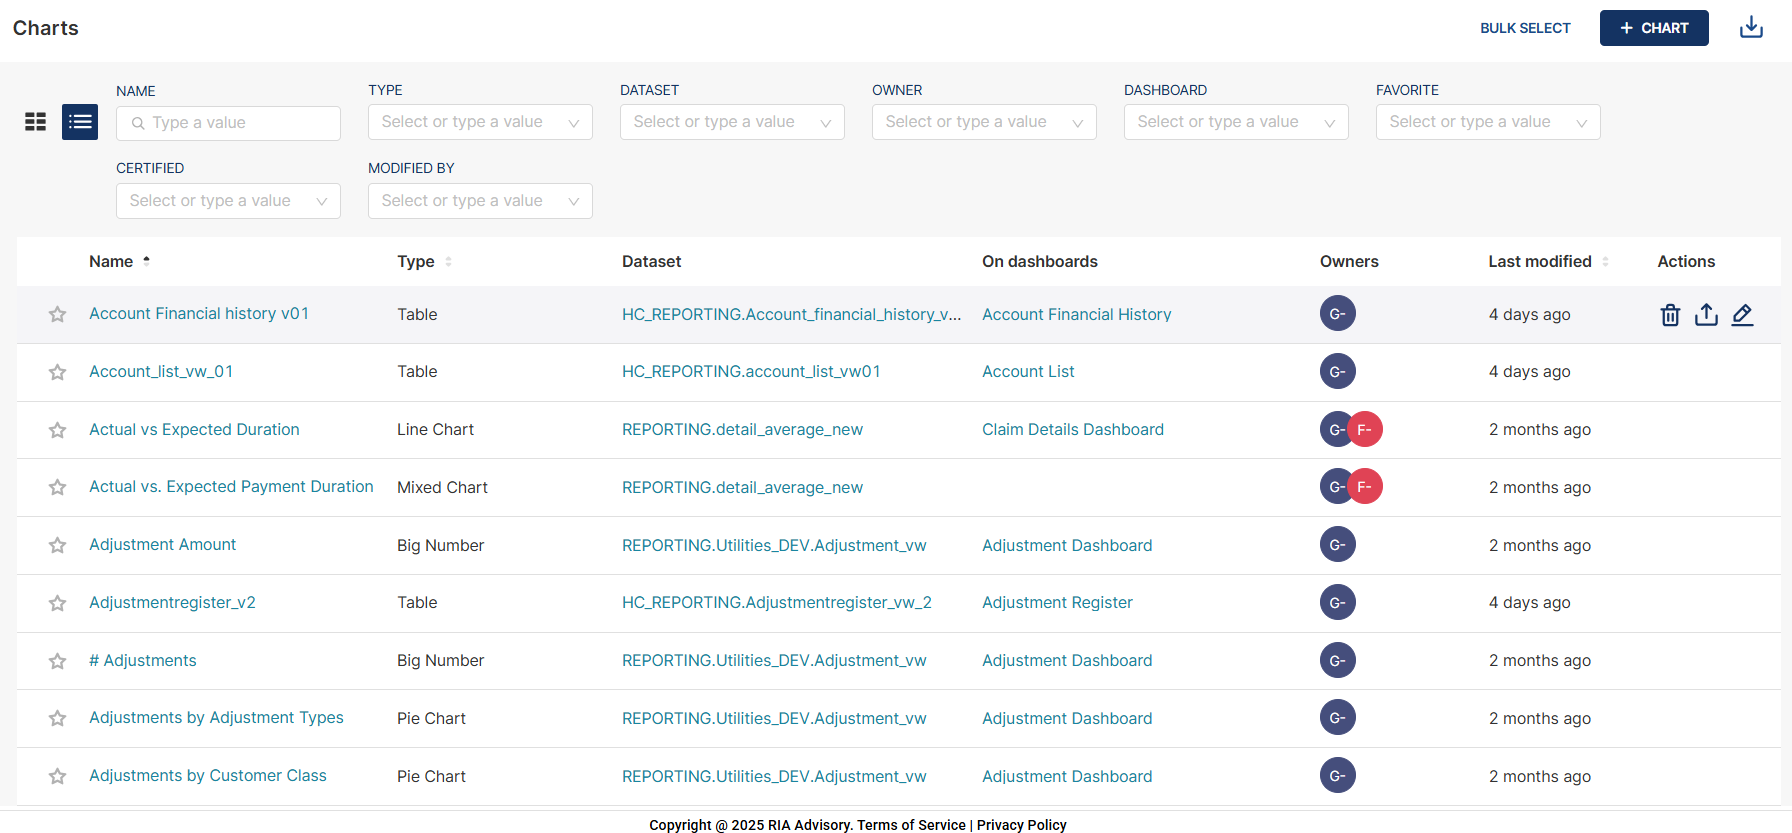
| Column name | Description |
|---|---|
| Name | Name of the chart. |
| Types | Specifies the chart type. |
| Dataset | Specifies the data source file used to generate the chart. |
| On dashboards | Lists all dashboards using the chart. |
| Owners | Lists the owners of the chart. |
| Last modified | Specifies the time when the chart was last modified. |
| Actions | When you hover to this column, the following icons are displayed: Delete, Export, and Edit. |
To sort a list view, click the sorting arrows next to the column name.
Card view
To switch from list view to card view, click the card view icon located in the upper left corner of the page. The cards displays only the chart name, the last modified date, and the favorite icon.
To sort charts in a card view, select the sorting order in the SORT dropdown field.
Filter
To filter the list of charts in card or list view, you can enter valid values or select a value from the list in the parameters on the headers. You can use one or more parameters for your filter.