Dashboard
The Dashboard is the main screen where the user interacts with the DIH Tool and provides a high-level overview of the data migration activities.
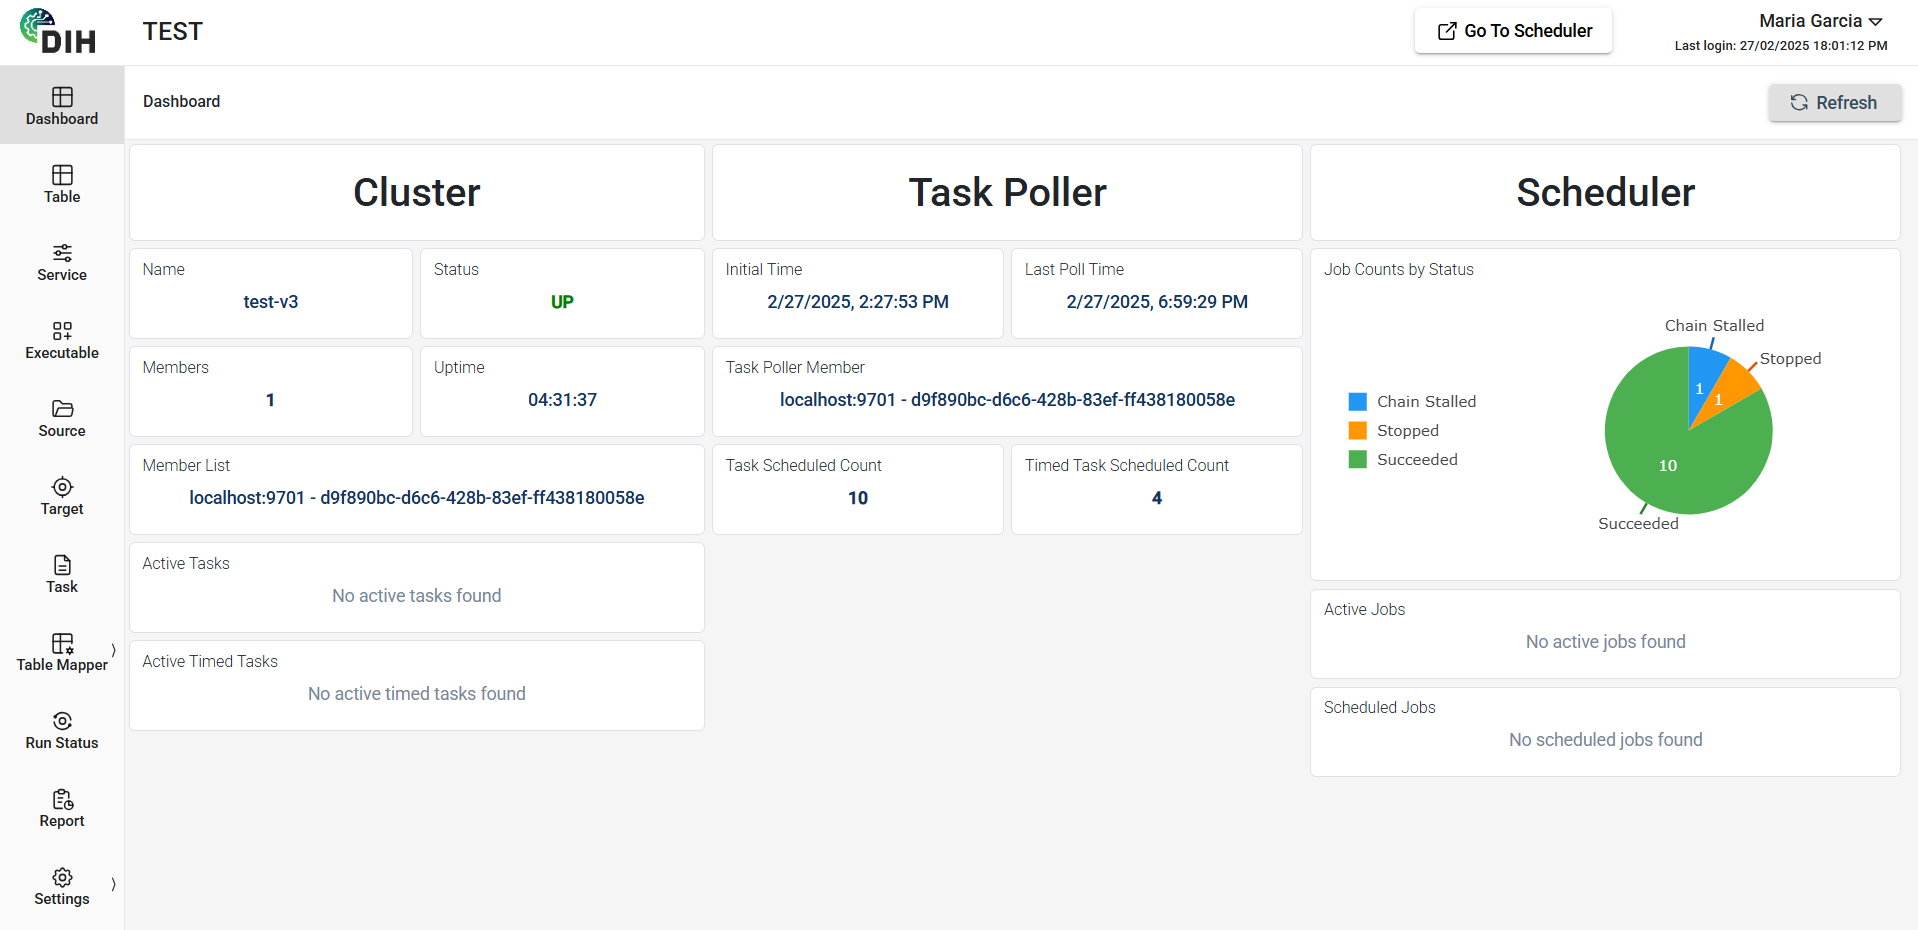
It is divided into three main sections: Cluster, Task Poller, and Scheduler.
Also, the dashboard includes the Go to Scheduler button which allows users to quickly access the Task scheduler module for managing programs, chains, schedules, and jobs.
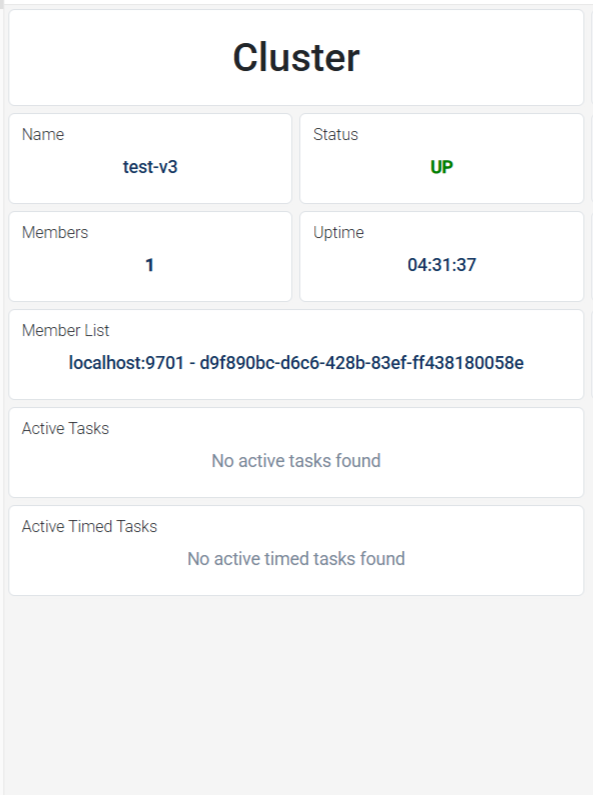
Cluster
The Cluster section monitors the overall status of the data migration environment.
| Field | Description |
|---|---|
| Name | Identifies the cluster name. |
| Status | Indicates the cluster’s status. The following are the possible values:
|
| Members | Displays the current number of active members. |
| Uptime | Displays the total runtime of cluster since it was last started. |
| Active Tasks | Displays tasks that are currently in progress within the cluster. |
| Active Timed Tasks | Displays tasks that are scheduled or timed within the cluster. |
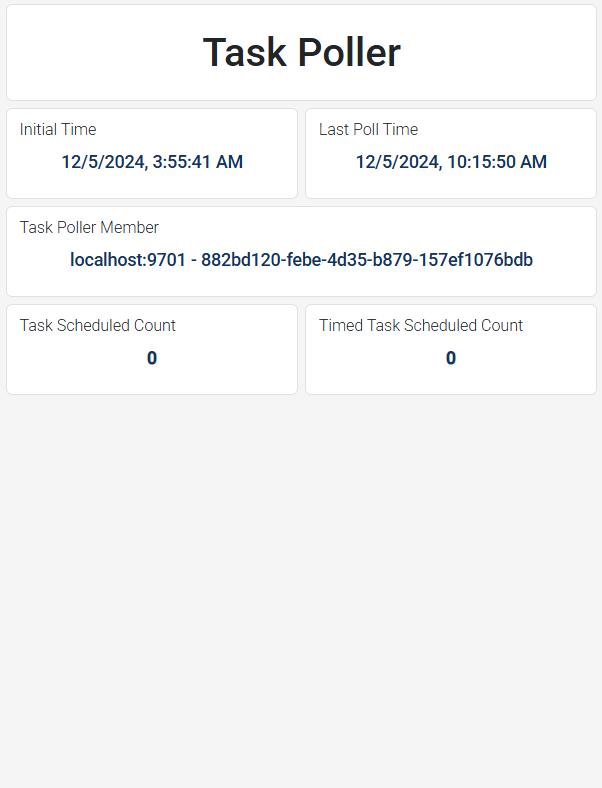
Task Poller
The Task Poller section monitors the executed scheduled jobs within the system.
| Field | Description |
|---|---|
| Initial Time | Displays the date and time when task poller started. |
| Last Poll Time | Displays the date and time when the task poller checked for new tasks. |
| Task Poller Member | Displays the server responsible for polling and executing tasks. |
| Task Scheduled Count | Displays the total number of tasks that have been scheduled. |
| Timed Task Scheduled Count | Displays the total number of tasks that are scheduled to executed at a specific time. |
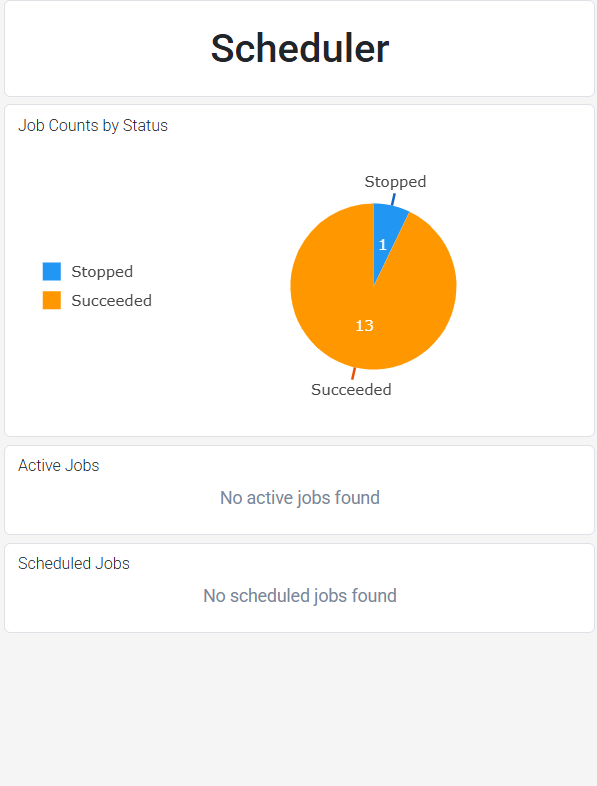
Scheduler
The Scheduler section monitors the job execution, including stalled, stopped, and successfully completed jobs.
| Field | Description |
|---|---|
| Job Counts by Status | Displays a pie chart that provides a quick visual representation of how the jobs are categorized. |
| Active Jobs | Displays the list of currently running jobs in the system. |
| Scheduled Jobs | Displays the list of scheduled jobs in the system. |